 Fireblaze
Learning Guides
Power BI DAX Functions Cheat Sheet (with Examples)
A Power BI DAX cheat sheet with 60+ functions and examples: CALCULATE, SUMX, time intelligence, window functions, UDFs, plus India-ready formulas.

You open Power BI, drag in your data, and build a chart in five minutes.
Then your manager asks for "sales this financial year vs last year, by region". And you're stuck staring at a blank formula bar.
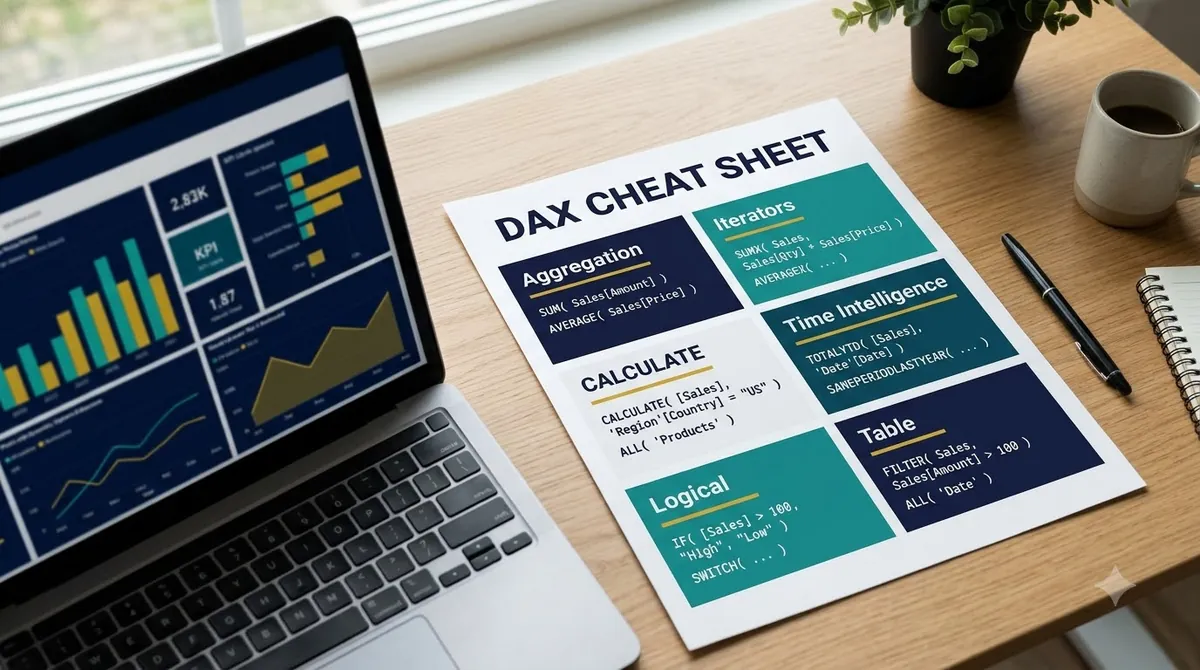
This Power BI DAX cheat sheet gets you unstuck. It covers the DAX functions Power BI users need most, each with a formula you can copy, all on one simple sales model.
You'll also get:
- The DAX features added since 2023 that older cheat sheets miss
- India-ready formulas: April to March financial year, GST and lakh-style labels
- The 10 DAX mistakes that break reports (and the fix for each)
Let's dive in.
Power BI DAX is the formula language you use to create measures, calculated columns and calculated tables in Power BI. DAX stands for Data Analysis Expressions, and it also runs in Analysis Services and Power Pivot in Excel. Everyday report work uses a small core of functions: aggregations, CALCULATE, iterators, time intelligence and a few logical and table functions.
Quick answer: power bi dax essentials (November 2026)
- The core DAX function is CALCULATE, which changes the filter context a measure is evaluated in.
- Measures calculate at report time for each visual cell; calculated columns calculate once per row at refresh and are stored in the model.
- Iterators such as SUMX evaluate an expression row by row and then aggregate, which SUM alone cannot do.
- Time intelligence functions such as TOTALYTD need a proper date table; for India's April to March year, set the year-end to "3/31".
- DAX user-defined functions became generally available in the June 2026 Power BI release, so you can now write reusable functions.
Contents
- The Sample Model Used in Every Example
- The DAX Ladder: Learn Functions in This Order
- Measures vs Calculated Columns
- Power BI DAX Aggregation Functions
- Iterator Functions (the X Functions)
- CALCULATE and Filter Functions in Power BI DAX
- Logical and Information Functions
- Time Intelligence DAX Functions
- Relationship, Table and Text Functions
- What's New in Power BI DAX
- DAX for Indian Reports: Fiscal Year, GST and Labels
- 10 Common DAX Mistakes and How to Fix Them
- FAQ
The Sample Model Used in Every Example
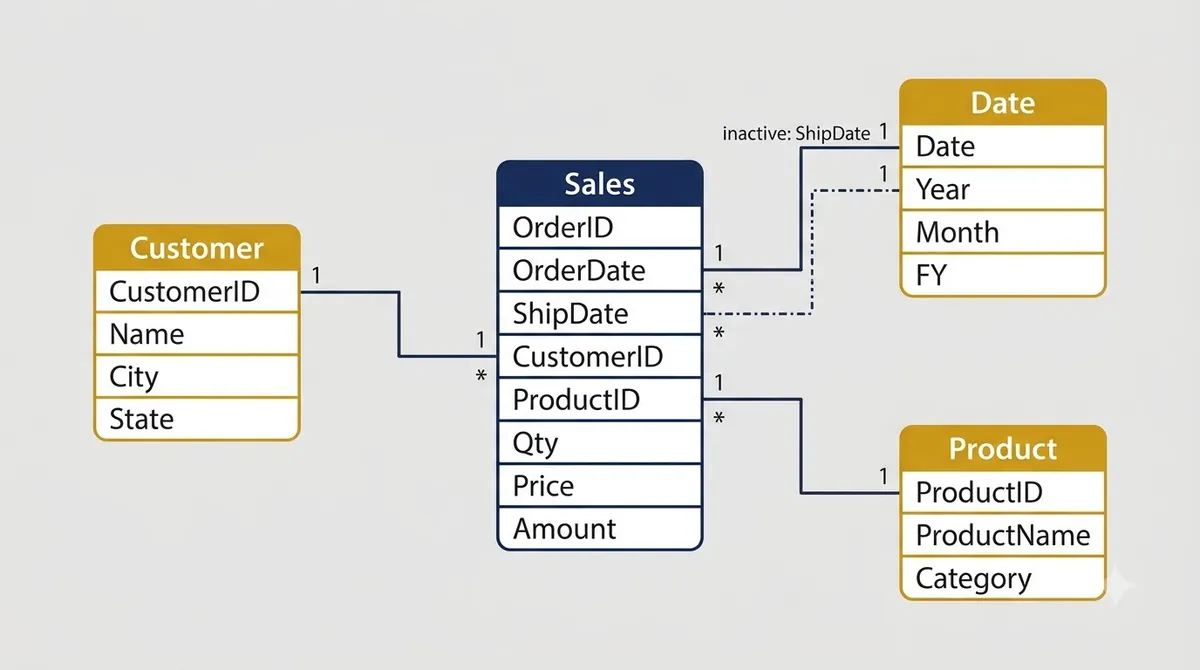
All the DAX formulas below run on one small sales model, so you can rebuild it and test each line. The model has four tables in a star schema:
| Table | Key columns | Role |
|---|---|---|
| Sales | OrderID, OrderDate, ShipDate, CustomerID, ProductID, Qty, Price, Amount | Fact table (one row per order line) |
| Product | ProductID, ProductName, Category | Dimension |
| Customer | CustomerID, Name, City, State | Dimension |
| Date | Date, Year, Month, FY | Date table, marked as date table |
Sales links to Product, Customer and Date (on OrderDate), much like the keys in SQL joins. A second, inactive relationship links Sales[ShipDate] to Date[Date], which you'll use with USERELATIONSHIP later.
Pro tip: Use the measure names from this page in your own model. Measures like [Total Sales] get reused inside almost every other formula, so name them clearly once.
The DAX Ladder: Learn Functions in This Order
The DAX Ladder is a five-rung learning order so each group of functions builds on the last. Most people get stuck on DAX because they jump to time intelligence before they understand filter context.
- Aggregate: SUM, COUNTROWS, DISTINCTCOUNT, DIVIDE. Answer "how much?"
- Iterate: SUMX, AVERAGEX, RANKX. Answer "how much, row by row?"
- Filter: CALCULATE, ALL, ALLSELECTED, FILTER. Answer "how much, under these conditions?"
- Time: TOTALYTD, SAMEPERIODLASTYEAR, DATEADD. Answer "how much, compared with when?"
- Shape: VAR, SWITCH, table functions. Answer "how do I keep this readable and reusable?"
Climbing one rung a week is a practical pace.
Measures vs Calculated Columns
A measure calculates at report time for each cell of a visual, while a calculated column calculates once per row during refresh and is stored in the model. Use measures for numbers you aggregate and slice; use calculated columns for values you filter, group or put on an axis.
| Measure | Calculated column | |
|---|---|---|
| Calculated when | Every time a visual renders | At data refresh |
| Stored in model | No (only the formula) | Yes (uses memory) |
| Context | Filter context | Row context |
| Example | Total Sales = SUM ( Sales[Amount] ) | Margin = Sales[Price] - Sales[Cost] |
| Use for | KPIs, totals, ratios | Slicers, groups, labels |
Rule of thumb: if you can write it as a measure, write it as a measure. Calculated columns make the file bigger.
Want more on this? It's one of the first questions in our Power BI interview questions guide.
Power BI DAX Aggregation Functions
Aggregation functions summarize a column in the current filter context. They're the first rung of the ladder and the building blocks for every other measure.
| Function | What it does | Example |
|---|---|---|
| SUM | Adds a numeric column | Total Sales = SUM ( Sales[Amount] ) |
| AVERAGE | Mean of a column | Avg Price = AVERAGE ( Sales[Price] ) |
| MIN / MAX | Smallest or largest value | Last Order = MAX ( Sales[OrderDate] ) |
| COUNT | Counts non-blank numbers | Priced Lines = COUNT ( Sales[Price] ) |
| COUNTROWS | Counts rows in a table | Orders = COUNTROWS ( Sales ) |
| DISTINCTCOUNT | Counts unique values | Customers = DISTINCTCOUNT ( Sales[CustomerID] ) |
| DIVIDE | Safe division, handles zero | Avg Order Value = DIVIDE ( [Total Sales], [Orders] ) |
Use DIVIDE instead of the / operator. DIVIDE returns a blank (or a value you choose as the third argument) when the denominator is zero, so your visuals don't show errors.
Iterator Functions (the X Functions)
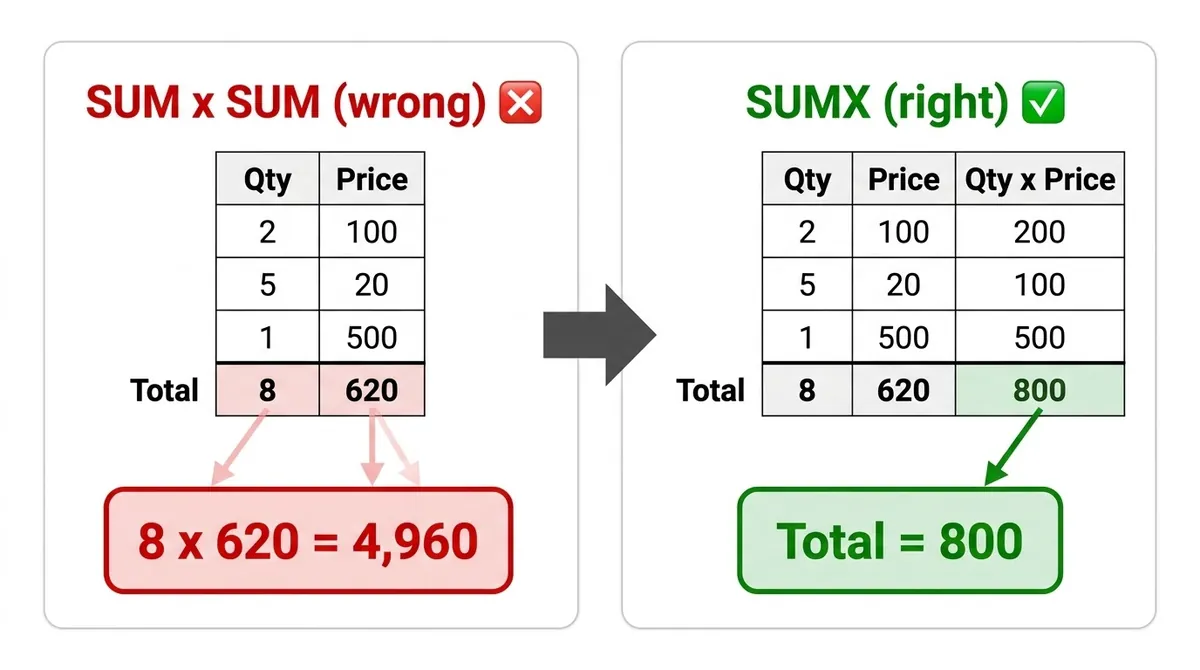
Iterator functions go through a table row by row, evaluate an expression for each row, then aggregate the results. You need them whenever the value doesn't exist as a single column, such as quantity times price.
| Function | What it does | Example |
|---|---|---|
| SUMX | Sum of a row-by-row expression | Revenue = SUMX ( Sales, Sales[Qty] * Sales[Price] ) |
| AVERAGEX | Average of a row-by-row expression | Avg Line Value = AVERAGEX ( Sales, Sales[Qty] * Sales[Price] ) |
| MAXX / MINX | Max or min of an expression | Biggest Line = MAXX ( Sales, Sales[Qty] * Sales[Price] ) |
| COUNTX | Counts non-blank results | Low-Price Lines = COUNTX ( FILTER ( Sales, Sales[Price] < 100 ), Sales[OrderID] ) |
| RANKX | Ranks items by an expression | Product Rank = RANKX ( ALL ( Product[ProductName] ), [Total Sales] ) |
| CONCATENATEX | Joins values into one text | Categories = CONCATENATEX ( VALUES ( Product[Category] ), Product[Category], ", " ) |
Here's the key idea: SUM ( Sales[Qty] ) * SUM ( Sales[Price] ) multiplies two totals, which gives the wrong revenue. SUMX multiplies first, row by row, and then adds.
CALCULATE and Filter Functions in Power BI DAX
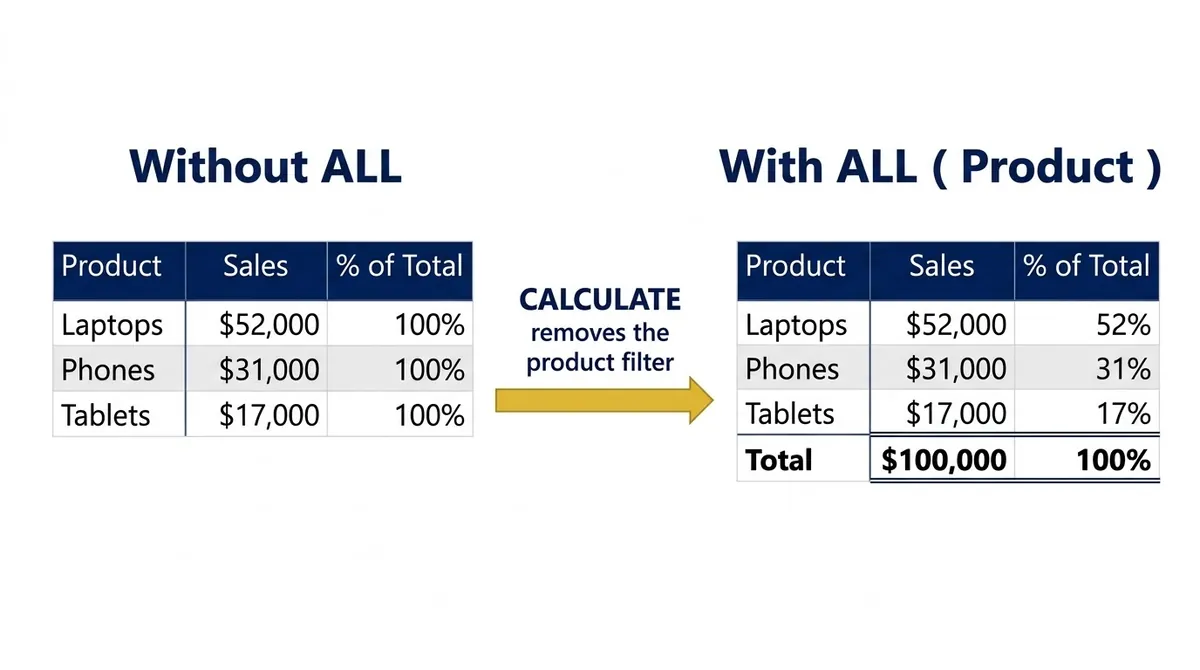
CALCULATE evaluates an expression in a modified filter context, and it's the single most important DAX function. Filters you pass on the same column replace the existing filter; filters on different columns combine with AND.
| Function | What it does | Example |
|---|---|---|
| CALCULATE | Changes the filter context | Sales MH = CALCULATE ( [Total Sales], Customer[State] = "Maharashtra" ) |
| FILTER | Returns a filtered table | Big Orders = CALCULATE ( [Orders], FILTER ( Sales, Sales[Amount] > 50000 ) ) |
| ALL | Removes filters from a table or column | % of Total = DIVIDE ( [Total Sales], CALCULATE ( [Total Sales], ALL ( Product ) ) ) |
| ALLSELECTED | Keeps slicer filters, removes visual filters | % of Selected = DIVIDE ( [Total Sales], CALCULATE ( [Total Sales], ALLSELECTED ( Product ) ) ) |
| ALLEXCEPT | Removes all filters except listed columns | Category Total = CALCULATE ( [Total Sales], ALLEXCEPT ( Product, Product[Category] ) ) |
| REMOVEFILTERS | Clears filters | All Cities = CALCULATE ( [Total Sales], REMOVEFILTERS ( Customer[City] ) ) |
| KEEPFILTERS | Adds a filter without overriding the current one | Pune Only = CALCULATE ( [Total Sales], KEEPFILTERS ( Customer[City] = "Pune" ) ) |
| USERELATIONSHIP | Activates an inactive relationship | Sales by Ship Date = CALCULATE ( [Total Sales], USERELATIONSHIP ( Sales[ShipDate], 'Date'[Date] ) ) |
| TREATAS | Applies values of one column as a filter on another | Target Sales = CALCULATE ( [Total Sales], TREATAS ( VALUES ( Targets[City] ), Customer[City] ) ) |
Two concepts make CALCULATE click:
- Filter context is the set of filters coming from slicers, rows, columns and visual filters.
- Context transition happens when CALCULATE runs inside row context (such as in a calculated column or an iterator). It turns the current row into a filter.
Note: Prefer simple Boolean filters like
Customer[State] = "Maharashtra"over FILTER on a whole table. They're easier to read and usually faster.
Logical and Information Functions
Logical functions return different results based on conditions, and information functions test what's in the current context. Together they handle labels, bands and "what did the user select?" logic.
| Function | What it does | Example |
|---|---|---|
| IF | Two-way condition | Target Met = IF ( [Total Sales] >= 1000000, "Yes", "No" ) |
| SWITCH | Many conditions, cleaner than nested IF | Size Band = SWITCH ( TRUE (), Sales[Amount] >= 100000, "Large", Sales[Amount] >= 25000, "Medium", "Small" ) |
| AND / OR, && / || | Combine conditions | Key Order = IF ( Sales[Amount] > 50000 && Sales[Qty] > 10, 1, 0 ) |
| COALESCE | First non-blank value | Sales or Zero = COALESCE ( [Total Sales], 0 ) |
| ISBLANK | Tests for blank | No Sales = ISBLANK ( [Total Sales] ) |
| SELECTEDVALUE | Single selected value, or a default | City Title = "Sales for " & SELECTEDVALUE ( Customer[City], "all cities" ) |
| HASONEVALUE | TRUE if one value is in context | Show Rank = IF ( HASONEVALUE ( Product[ProductName] ), [Product Rank] ) |
| ISINSCOPE | TRUE at a given hierarchy level | Level = IF ( ISINSCOPE ( Product[ProductName] ), "Product", "Category" ) |
Use SWITCH ( TRUE (), ... ) any time you'd nest three or more IFs. Your future self will thank you.
Time Intelligence DAX Functions
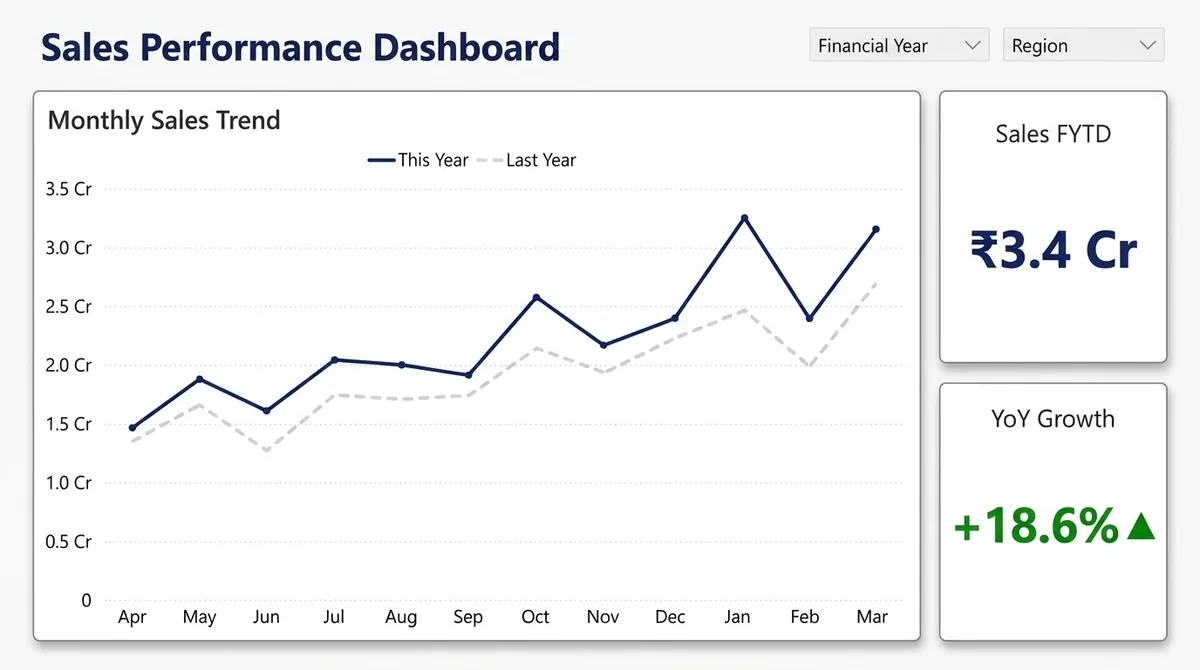
Time intelligence functions compare values across periods, such as year to date or same period last year. They need a proper date table with one row per day, marked as a date table in Power BI.
First, create the date table (this one runs April 2024 to March 2027):
Date =
ADDCOLUMNS (
    CALENDAR ( DATE ( 2024, 4, 1 ), DATE ( 2027, 3, 31 ) ),
    "Year", YEAR ( [Date] ),
    "Month", FORMAT ( [Date], "MMM" ),
    "FY", IF ( MONTH ( [Date] ) >= 4, YEAR ( [Date] ) + 1, YEAR ( [Date] ) )
)
Then use these:
| Function | What it does | Example |
|---|---|---|
| TOTALYTD | Year-to-date total | Sales YTD = TOTALYTD ( [Total Sales], 'Date'[Date] ) |
| TOTALQTD / TOTALMTD | Quarter or month to date | Sales MTD = TOTALMTD ( [Total Sales], 'Date'[Date] ) |
| SAMEPERIODLASTYEAR | Same dates, one year back | Sales LY = CALCULATE ( [Total Sales], SAMEPERIODLASTYEAR ( 'Date'[Date] ) ) |
| DATEADD | Shift dates by an interval | Sales PM = CALCULATE ( [Total Sales], DATEADD ( 'Date'[Date], -1, MONTH ) ) |
| DATESINPERIOD | Rolling window of dates | Sales 3M = CALCULATE ( [Total Sales], DATESINPERIOD ( 'Date'[Date], MAX ( 'Date'[Date] ), -3, MONTH ) ) |
| DATESBETWEEN | Dates between two dates | Diwali Week = CALCULATE ( [Total Sales], DATESBETWEEN ( 'Date'[Date], DATE ( 2026, 11, 5 ), DATE ( 2026, 11, 11 ) ) ) |
| PREVIOUSMONTH | All dates of the previous month | Last Month = CALCULATE ( [Total Sales], PREVIOUSMONTH ( 'Date'[Date] ) ) |
| PARALLELPERIOD | Full shifted period | Last Year Full = CALCULATE ( [Total Sales], PARALLELPERIOD ( 'Date'[Date], -1, YEAR ) ) |
And the measure every manager asks for, written with variables:
YoY Growth % =
VAR CurrentSales = [Total Sales]
VAR LastYearSales = [Sales LY]
RETURN
    DIVIDE ( CurrentSales - LastYearSales, LastYearSales )
VAR and RETURN store a value once and reuse it. Your formula reads better and the engine doesn't calculate the same thing twice.
Relationship, Table and Text Functions
Relationship functions pull values across related tables, table functions return whole tables, and text functions clean up labels. You'll use them for lookups, top-N lists and readable titles.
| Function | Category | Example |
|---|---|---|
| RELATED | Relationship | Column in Sales: Category = RELATED ( Product[Category] ) |
| RELATEDTABLE | Relationship | Column in Customer: Order Count = COUNTROWS ( RELATEDTABLE ( Sales ) ) |
| LOOKUPVALUE | Relationship | Price List = LOOKUPVALUE ( PriceList[Price], PriceList[ProductID], Sales[ProductID] ) |
| VALUES / DISTINCT | Table | Cities = COUNTROWS ( VALUES ( Customer[City] ) ) |
| TOPN | Table | Top 5 Sales = CALCULATE ( [Total Sales], TOPN ( 5, ALL ( Product[ProductName] ), [Total Sales] ) ) |
| SUMMARIZECOLUMNS | Table | City Summary = SUMMARIZECOLUMNS ( Customer[City], "Sales", [Total Sales] ) |
| ADDCOLUMNS | Table | With Rank = ADDCOLUMNS ( VALUES ( Product[ProductName] ), "Sales", [Total Sales] ) |
| FORMAT | Text | Sales Label = FORMAT ( [Total Sales], "#,##0" ) |
| LEFT / RIGHT / MID | Text | State Code = LEFT ( Customer[State], 2 ) |
| UPPER / LOWER / TRIM | Text | Clean City = TRIM ( UPPER ( Customer[City] ) ) |
| SEARCH / CONTAINSSTRING | Text | Is Phone = CONTAINSSTRING ( Product[ProductName], "phone" ) |
Important: FORMAT returns text. Use it for titles and labels, never for a number you want to sort, sum or chart.
Building these into a full report? Our Power BI dashboard tutorial walks through it step by step.
What's New in Power BI DAX
Most older DAX cheat sheets stop before the newest features. Microsoft's DAX function reference now covers more than 250 functions (Microsoft Learn), so the list in this guide is a working subset, not the full reference.
User-defined functions
DAX user-defined functions (UDFs) let you package logic once and reuse it. They became generally available in Power BI Desktop and the Power BI Service with the June 2026 release, and need database compatibility level 1702 or higher (Microsoft Learn). In his 2025 year-end review, Marco Russo of SQLBI called UDFs the biggest change to the language since variables arrived in 2015 (SQLBI).
Visual calculations
A visual calculation is a DAX calculation defined on a visual instead of in the model. For example, Running Total = RUNNINGSUM ( [Total Sales] ) or Vs Previous = [Total Sales] - PREVIOUS ( [Total Sales] ). Use a visual calculation for a quick comparison on one visual; use a measure when several visuals need the same number.
Note: Check the current Microsoft Learn list of visual calculation functions before you rely on a specific one, since the list changes between releases.
DAX for Indian Reports: Fiscal Year, GST and Labels
Indian reports often need an April to March financial year, GST and figures shown in lakhs or crores. Here's how to handle each in DAX.
Financial year (April to March)
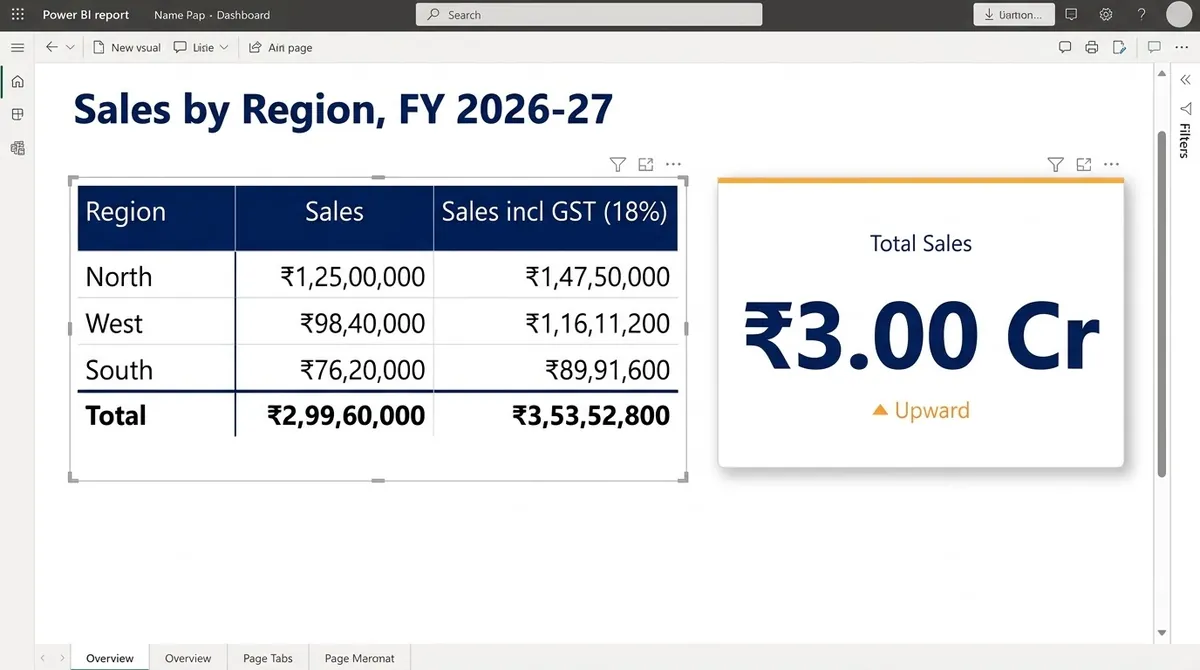
TOTALYTD takes an optional year-end date, so pass "3/31" for India's financial year:
Sales FYTD = TOTALYTD ( [Total Sales], 'Date'[Date], "3/31" )The FY column in the date table above labels April 2026 to March 2027 as FY 2027. Change the formula if your company labels it FY 2026-27.
GST-inclusive sales
A plain measure is the simplest way to add 18% GST:
Sales incl GST = [Total Sales] * 1.18If the rate changes, update the one measure and every visual that uses it follows.
Crore labels
For a card label such as "₹3.00 Cr", a text measure is fine, since cards don't sort or chart:
Sales Cr Label = "₹" & FORMAT ( DIVIDE ( [Total Sales], 10000000 ), "0.00" ) & " Cr"Use this only on cards and labels. Keep the numeric measure for anything you sort or chart.
10 Common DAX Mistakes and How to Fix Them
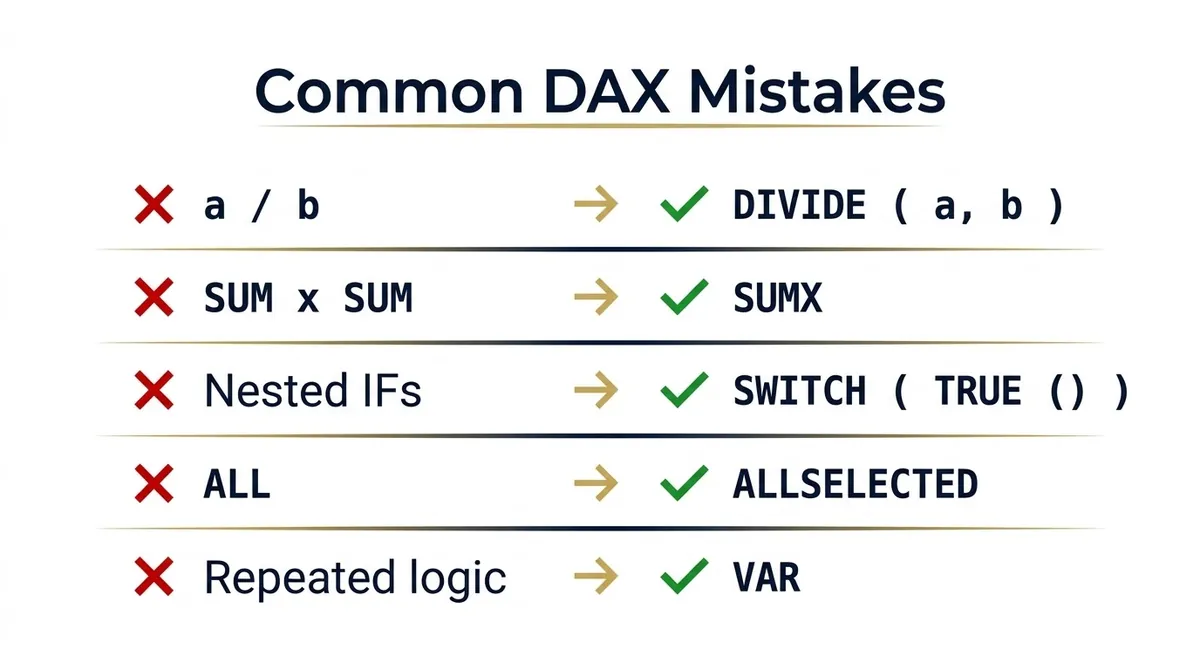
Most broken Power BI reports come from the same DAX mistakes. Check this list before you blame the data.
| # | Mistake | Fix |
|---|---|---|
| 1 | Using / and getting errors on zero | Use DIVIDE ( a, b ) |
| 2 | SUM ( Qty ) * SUM ( Price ) for revenue | Use SUMX ( Sales, Sales[Qty] * Sales[Price] ) |
| 3 | Calculated columns for every KPI | Write measures; keep columns for slicers and groups |
| 4 | Time intelligence on the auto date table | Build a date table and mark it as a date table |
| 5 | TOTALYTD resetting on 31 December for an April to March year | Add the "3/31" year-end argument |
| 6 | FILTER over a whole fact table inside CALCULATE | Use a column filter: Customer[State] = "Maharashtra" |
| 7 | Using ALL when you meant "respect the slicer" | Use ALLSELECTED |
| 8 | Nested IFs five levels deep | Use SWITCH ( TRUE (), ... ) |
| 9 | FORMAT on numbers you need to chart | Keep the numeric measure; use FORMAT only for labels |
| 10 | Repeating the same sub-calculation | Store it once with VAR |
Mistake 2 is the one interviewers love. If you can explain why SUMX and SUM give different revenue, you're ahead of many candidates. More practice questions are in our data analyst interview questions guide.
Power BI DAX: Your Next Step
Power BI DAX looks big, but a core set of functions and one idea, filter context, handle most business questions. Climb the DAX Ladder: aggregate, iterate, filter, time, then shape.
So pick one measure from each table above and rebuild it on your own data this week. Then try the Power BI projects for your resume to put the formulas to work.
Want structured practice with trainer feedback? Look at the Fireblaze Power BI course. Which Power BI DAX function gives you the most trouble right now?
FAQ
What is DAX in Power BI?
DAX (Data Analysis Expressions) is the formula language of Power BI, used to create measures, calculated columns and calculated tables. It also runs in Analysis Services and Power Pivot in Excel. DAX works on tables and columns, not cells, so Excel formulas like those in our IF, VLOOKUP and XLOOKUP guide can't be pasted in directly.
What are the most important Power BI DAX functions?
The most important Power BI DAX functions are CALCULATE, SUM, SUMX, DIVIDE, COUNTROWS, DISTINCTCOUNT, FILTER, ALL, ALLSELECTED, RELATED, SWITCH, SELECTEDVALUE, TOTALYTD, SAMEPERIODLASTYEAR and DATEADD. Learn CALCULATE and filter context first, because almost every advanced formula depends on them.
How many DAX functions are there?
Microsoft's DAX function reference covers more than 250 functions, including aggregation, filter, time intelligence, logical, text and table functions. You don't need all of them; a core set covers most business reports.
What is the difference between SUM and SUMX in DAX?
SUM adds the values of one column in the current filter context. SUMX goes row by row through a table, evaluates an expression for each row (such as quantity times price) and then adds the results. Use SUMX whenever the value you want to add doesn't exist as a single column.
Is DAX hard to learn?
DAX basics take a few days, but filter context and CALCULATE take most people a few weeks of practice. Learning in order (aggregations, iterators, CALCULATE, time intelligence, then variables and table functions) makes it much easier than jumping straight into complex formulas.
Are DAX user-defined functions available in Power BI now?
Yes. DAX user-defined functions became generally available in Power BI Desktop and the Power BI Service with the June 2026 release. Your model needs compatibility level 1702 or higher.
Sources
- Microsoft Learn: DAX function reference, 2026
- Microsoft Learn: DAX user-defined functions, 2026
- SQLBI: What happened in the DAX world in 2025, December 2025