 Fireblaze
Learning Guides
15 Power BI Projects for Your Resume (with Free Datasets and Resume Bullet Templates)
15 Power BI projects for your resume with free datasets, 6 from India (UPI, RBI, IPL, Zomato), a resume bullet template for each and safe ways to share your work.

You finished a Power BI course. You can build a bar chart, add a slicer and write a SUM measure.
But your resume still says "Skills: Power BI" and nothing else. Recruiters see that line hundreds of times a week.
This guide fixes that. You get 15 Power BI projects for resume building with free datasets (six of them built on Indian data), a resume bullet template for each, and a simple test that tells you whether a project is strong enough to show an interviewer.
Power BI projects are hands-on dashboards and reports you build in Power BI Desktop from a real dataset to answer a business question. A resume-ready project shows four things: cleaned data in Power Query, a proper data model, DAX measures that calculate KPIs, and one clear decision the dashboard supports.
Quick answer: Power BI projects for your resume (November 2026)
- Build three to five Power BI projects, not fifteen: one beginner, two intermediate and one advanced project is enough to start applying.
- Microsoft's free sample datasets (Financial, Retail Analysis, Human Resources) are the safest first projects because the data is clean.
- Indian datasets such as NPCI UPI statistics, RBI's Database on Indian Economy and Zomato listings make a portfolio stand out from copies of the Superstore dataset.
- Power BI Desktop is free and works without signing in, but the Power BI service requires a work or school account, so plan how you will share your work.
- Publish to web makes a report viewable by anyone without signing in, so use it only with open data.
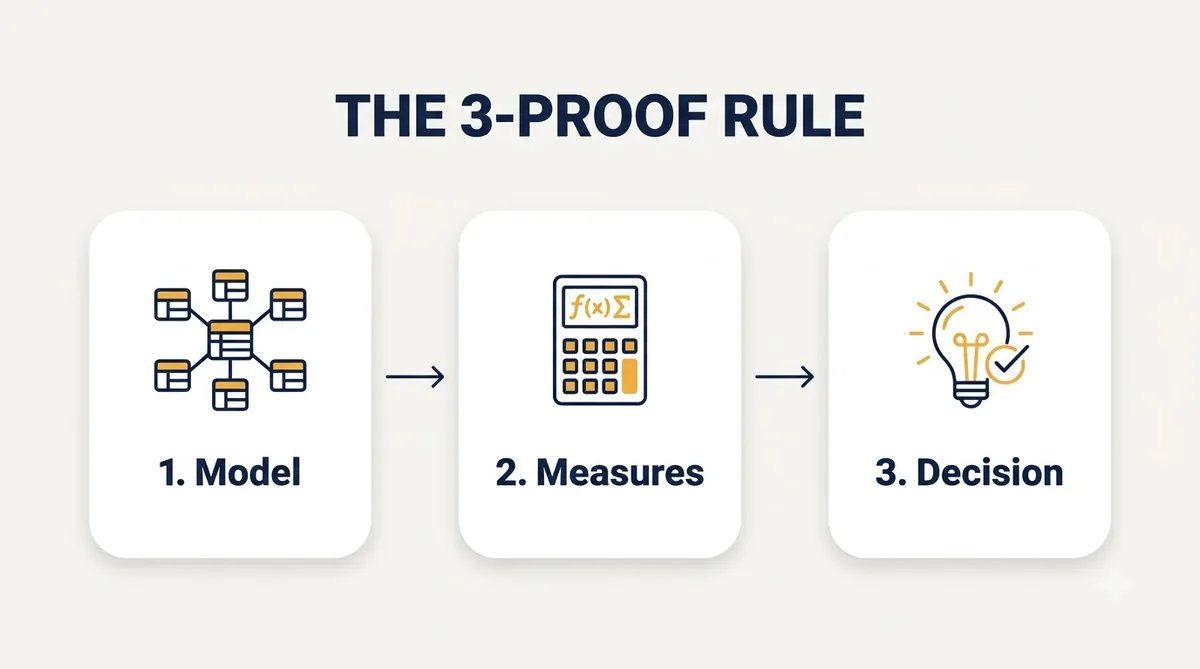
- Every project should pass the 3-Proof Rule: a clean model, at least three DAX measures and one written business decision.
What Makes Power BI Projects Resume-Worthy?
Resume-worthy Power BI projects answer a business question with data, not just display charts. A recruiter or hiring manager spends a few minutes on a portfolio, so the project has to show your thinking fast.
Here is what separates a project that gets interview calls from one that gets skipped:
- A question in the title. "Which Bangalore localities are under-served by mid-price restaurants?" beats "Zomato Dashboard".
- A real data model. Fact and dimension tables in a star schema, not one flat sheet with 40 columns.
- Measures, not just columns. DAX measures for KPIs such as revenue growth, churn rate or average ticket size.
- Interaction. Slicers, drill-through pages and tooltips that let someone explore.
- A written takeaway. Two or three sentences on what the data says and what a manager should do.
Many project lists name the ideas but skip the last point. That is the part interviewers tend to ask about, for example "Walk me through your data model" or "Why did you choose this KPI?"

The 3-Proof Rule: Is Your Project Ready?
The 3-Proof Rule is a simple test to check whether a Power BI project is ready for a resume. A project passes only if it proves all three things below.
| Proof | What it means | How a recruiter checks it |
|---|---|---|
| 1. Model proof | Data cleaned in Power Query and loaded into a star schema with clear relationships | Screenshot of the Model view in your README |
| 2. Measure proof | At least three DAX measures that answer the question (for example YoY growth, % of total, running total) | Measure names visible in the report or listed in GitHub |
| 3. Decision proof | One written recommendation backed by the numbers | A short "Key insight" text box on the first page |
If a project fails one proof, fix that before you build another project. Three projects that pass beat ten that do not.
Where to Find Free Datasets for Your Projects
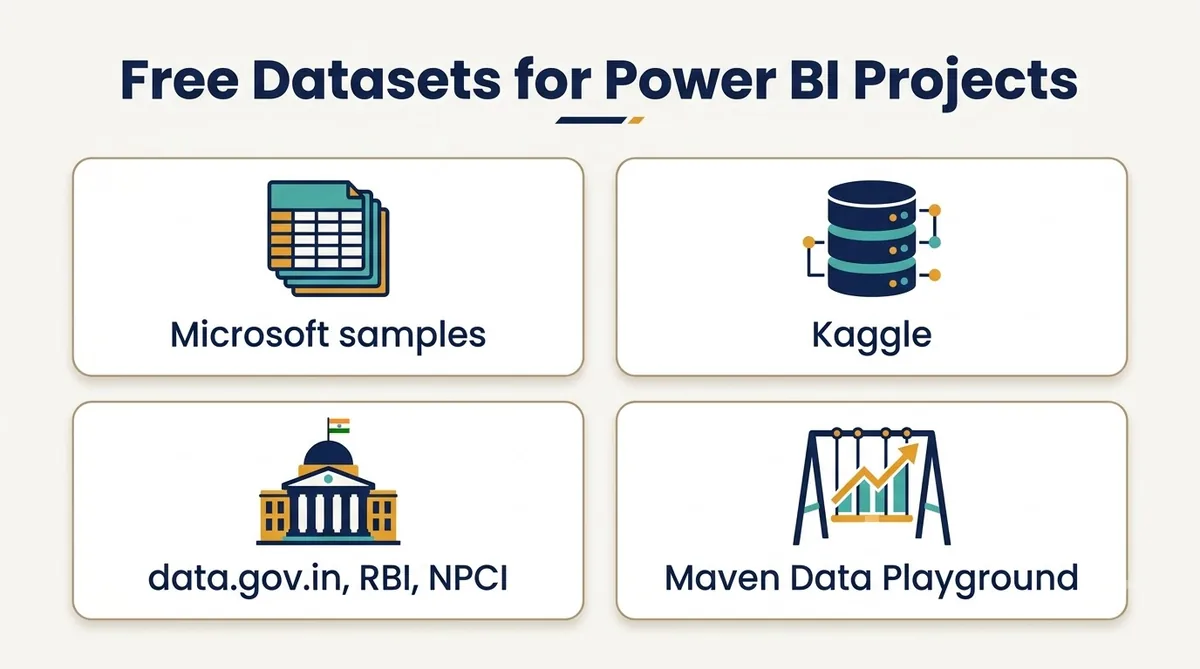
Free Power BI datasets come from four main places: Microsoft's own samples, Kaggle, India's government open-data portals and Maven Analytics' Data Playground.
Microsoft sample datasets. Microsoft publishes Power BI sample datasets, including Financial, Retail Analysis and Human Resources, with .pbix files on GitHub. Start here because the structure is predictable.
Kaggle. The largest free source. Popular picks include the IBM HR Attrition, Telco Customer Churn and Superstore datasets. Check each dataset's licence before you publish.
Indian open data. This is where your portfolio can stand apart:
- data.gov.in: India's Open Government Data Platform. Most datasets fall under the Government Open Data Licence India, which allows reuse with attribution.
- RBI Database on Indian Economy (DBIE): time-series data on inflation, credit, deposits and more, downloadable from data.rbi.org.in.
- NPCI UPI statistics: monthly figures on banks live on UPI, transaction volume and value.
Maven Analytics Data Playground. Free datasets picked by instructors, often with a challenge attached.
Datasets that thousands of learners have already used will be familiar to recruiters. Use them for practice, then build at least one portfolio piece on data that fewer people have analysed.
Beginner Power BI Projects (1 to 5)
Beginner Power BI projects teach the full workflow: import, clean in Power Query, model, write basic DAX and design a one-page report. If you are still learning the interface, start with our beginner's guide to learning Power BI.
1. Sales and Profit Dashboard (Microsoft Financial Sample)
Dataset: Microsoft Financial Sample, a flat table of sales and profit by segment, country, product and month. In Power BI Desktop you can load it from the sample data option.
Build:
- Split the flat table into a fact table and Product, Country and Date dimensions
- Measures: Total Sales, Profit Margin %, Sales YoY %
- A matrix of profit by segment and country with conditional formatting
Skills proved: star schema from a flat file, date table, basic time intelligence.
Resume bullet template: "Rebuilt a flat sales file into a 4-table star schema in Power BI and created YoY and margin measures, showing that [segment] delivered [X]% of profit on [Y]% of sales."
2. Retail Store Performance Report (Microsoft Retail Analysis Sample)
Dataset: Microsoft's Retail Analysis sample, covering sales across stores and districts.
Build:
- A district overview page and a store drill-through page
- Measures: Sales per Sq Ft, This Year vs Last Year, New Store vs Same Store sales
- Tooltips showing each store's top categories
Skills proved: drill-through, report page design, comparing periods.
Resume bullet template: "Designed a 2-page Power BI retail report with store drill-through, identifying [N] stores below district average on sales per sq ft."
3. HR Attrition and Headcount Dashboard (IBM HR Dataset)
Dataset: IBM HR Analytics Attrition dataset on Kaggle.
Build:
- Attrition rate by department, job role, overtime and tenure band
- Bins for age and years at company
- A "Key insight" box on which group HR should focus retention on
Skills proved: grouping and binning, % of total measures, storytelling for a non-technical audience.
Resume bullet template: "Built an HR attrition dashboard in Power BI; found that employees working overtime left at [X] times the rate of others and recommended a retention review for [role]."
4. Telecom Customer Churn Analysis (Telco Churn Dataset)
Dataset: Telco Customer Churn on Kaggle.
Build:
- Churn rate by contract type, payment method and tenure
- Revenue at risk measure (monthly charges of churned customers)
- A what-if parameter for "If we cut churn by X%, revenue saved is..."
Skills proved: what-if parameters, calculated measures for business impact.
Resume bullet template: "Quantified [$X] in monthly revenue at risk from churn in Power BI and modelled savings from a [Y]% churn reduction using a what-if parameter."
5. Grocery Assortment and Discount Explorer (BigBasket, India)
Dataset: BigBasket Entire Product List on Kaggle, about 28,000 products with category, brand, sale price, market price and rating.
Build:
- Discount % measure (market price vs sale price) by category and brand
- Scatter chart of discount vs rating
- Top 10 brands per category using a TOPN measure
Skills proved: Power Query cleaning of messy text fields, TOPN, scatter analysis, Indian retail context in INR.
Resume bullet template: "Cleaned about 28,000 BigBasket product records in Power Query and built a discount-vs-rating explorer, showing that [category] carried the deepest average discount at [X]%."

Intermediate Power BI Projects (6 to 11)
Intermediate Power BI projects add larger datasets, multiple tables, time intelligence and more advanced DAX. Several use Indian data, which gives you local talking points in interviews. For a step-by-step build first, see our Power BI dashboard tutorial.
6. Restaurant Market Gap Map (Zomato Bangalore, India)
Dataset: Zomato Bangalore Restaurants on Kaggle, with 51,717 rows and 17 columns.
Build:
- Clean the "approx cost for two" and rating fields in Power Query
- Map of restaurant count by locality, coloured by average rating
- A gap table: localities with high ratings but few mid-price options
Skills proved: handling a large, messy file, map visuals, turning analysis into a business recommendation.
Resume bullet template: "Processed 51,717 Zomato listings in Power BI to map restaurant density by Bangalore locality, flagging [N] areas with high ratings and few mid-price options."
7. City Air Quality Tracker (CPCB Data, India)
Dataset: Air Quality Data in India (2015 to 2020) on Kaggle, compiled from Central Pollution Control Board data, with AQI and pollutants such as PM2.5, PM10, NO2 and O3 across Indian cities.
Build:
- Monthly AQI trend by city with a 30-day rolling average measure
- Count of "Poor" or worse days per city per year
- A seasonal heatmap (month vs city)
Skills proved: rolling averages in DAX, heatmaps, public-interest storytelling.
Resume bullet template: "Built a CPCB air quality tracker in Power BI with 30-day rolling AQI measures, showing [city] had [X] 'Poor' days in [year]."
8. UPI Payments Growth Dashboard (NPCI, India)
Dataset: NPCI's monthly UPI product statistics: number of banks live on UPI, volume and value. Download from npci.org.in and add new months as they are published.
Build:
- Measures: MoM growth %, YoY growth %, average ticket size (value divided by volume)
- A line chart of volume and value on dual axes
- A card showing the latest month and its growth
Skills proved: time intelligence (SAMEPERIODLASTYEAR, DATEADD), refreshable data, finance and fintech context.
Resume bullet template: "Created a UPI growth dashboard from NPCI monthly data with MoM, YoY and average ticket size measures, refreshed each month from the source file."

9. IPL Team and Player Performance (IPL Dataset, India)
Dataset: IPL Complete Dataset on Kaggle, with a matches table and a ball-by-ball deliveries table. Check the file notes for the seasons covered.
Build:
- Relationship between matches and deliveries on match ID
- Measures: strike rate, economy rate, win % batting first vs chasing
- A player drill-through page
Skills proved: modelling two related fact tables, ratio measures, and a fun dataset that still shows serious modelling.
Resume bullet template: "Modelled [N] IPL deliveries across [M] matches in Power BI and built strike-rate and economy measures with a player drill-through page."
10. RFM Customer Segmentation (Superstore)
Dataset: Superstore dataset on Kaggle.
Build:
- Recency, Frequency and Monetary scores per customer with DAX
- Segments such as Champions, At Risk and Lost
- A table of customers to target for a win-back campaign
Skills proved: customer-level calculated tables, scoring logic, a marketing use case. Superstore is common, so the RFM logic is what makes this one stand out.
Resume bullet template: "Segmented [N] customers using RFM scoring in DAX and identified an 'At Risk' group worth [X]% of revenue for a win-back campaign."
11. Marketing Campaign ROI Report
Dataset: Marketing Analytics dataset on Kaggle (campaign responses, channel purchases and customer attributes).
Build:
- Response rate per campaign and per channel
- Customer profile of responders vs non-responders
- A recommendation on which campaign to scale
Skills proved: comparing groups, funnel thinking, marketing analytics vocabulary.
Resume bullet template: "Compared response rates across [N] campaigns in Power BI and recommended scaling [campaign], which converted at [X]% vs a [Y]% average."

Advanced Power BI Projects (12 to 15)
Advanced Power BI projects show skills that working analysts use daily: multiple fact tables, row-level security, performance tuning and data that refreshes. Allow two to three weeks each.
12. Supply Chain Delivery Performance (DataCo)
Dataset: DataCo Smart Supply Chain on Kaggle.
Build:
- Late delivery rate by shipping mode, region and product
- Scheduled vs actual shipping days measure
- A profit-impact page for late orders
Skills proved: large-table performance (remove unused columns, prefer measures over calculated columns), operations KPIs.
Resume bullet template: "Analysed DataCo supply chain orders in Power BI and found that [shipping mode] caused [X]% of late deliveries, with a profit impact of [Y]."
13. Indian Economy Brief for a Bank (RBI DBIE, India)
Dataset: RBI's Database on Indian Economy, which offers downloadable time series on inflation, bank credit, deposits and interest rates.
Build:
- Combine three or four series (for example CPI inflation, repo rate, bank credit growth) on one date table
- Measures for YoY change and the gap between credit growth and deposit growth
- A one-page economic brief a credit team could read in two minutes
Skills proved: combining several sources, unpivoting wide Excel files in Power Query, and finance domain knowledge for BFSI roles.
Resume bullet template: "Combined [N] RBI DBIE series in Power BI into a monthly economic brief with YoY and credit-deposit gap measures for a BFSI audience."
14. Executive KPI Report with Row-Level Security
Dataset: one of Microsoft's sample datasets with a regional breakdown (such as Store Sales or Human Resources), or any multi-region dataset from projects 1 to 12.
Build:
- Roles so each regional manager sees only their region
- A KPI page with targets vs actuals and variance %
- Bookmarks for "Summary" and "Detail" views
Skills proved: row-level security (RLS), bookmarks, executive design. RLS is part of the "Manage and secure Power BI" area of Microsoft's PL-300 study guide, so this project doubles as exam practice.
Resume bullet template: "Built an executive KPI report with row-level security for [N] regional roles, target-vs-actual variance measures and bookmark navigation."
15. Local Business Dashboard (Your Own Data)
Dataset: real data from a local business, college department or family shop, with written permission and personal details removed. Monthly sales from a kirana store or admissions data from a college office both work.
Build:
- Whatever answers the owner's real question (best-selling items, slow months, outstanding payments)
- A refresh process from their Excel or Google Sheet
- A short note from the owner on what they changed
Skills proved: requirement gathering, working with messy real data, a genuine outcome. This is the closest a fresher can get to work experience.
Resume bullet template: "Built a Power BI sales dashboard for a [type of business] in [city] from their monthly Excel records; the owner used it to [real action]."

The PL-300 Skill Map: What Each Project Proves
Microsoft's PL-300 study guide groups the exam into four skill areas: preparing the data, modelling the data, visualising and analysing the data, and managing and securing Power BI. If your projects together cover all four areas, your portfolio matches what the exam tests.
| # | Project | Prepare | Model | Visualize | Secure |
|---|---|---|---|---|---|
| 1 | Sales and profit (Financial) | ✓ | ✓ | ✓ | |
| 3 | HR attrition | ✓ | ✓ | ||
| 5 | BigBasket discounts | ✓ | ✓ | ||
| 6 | Zomato market gap | ✓ | ✓ | ✓ | |
| 8 | UPI growth (NPCI) | ✓ | ✓ | ✓ | |
| 9 | IPL performance | ✓ | ✓ | ||
| 10 | RFM segmentation | ✓ | ✓ | ||
| 13 | RBI economy brief | ✓ | ✓ | ✓ | |
| 14 | Executive KPI with RLS | ✓ | ✓ | ✓ | |
| 15 | Local business | ✓ | ✓ | ✓ | ✓ (if published to a workspace) |
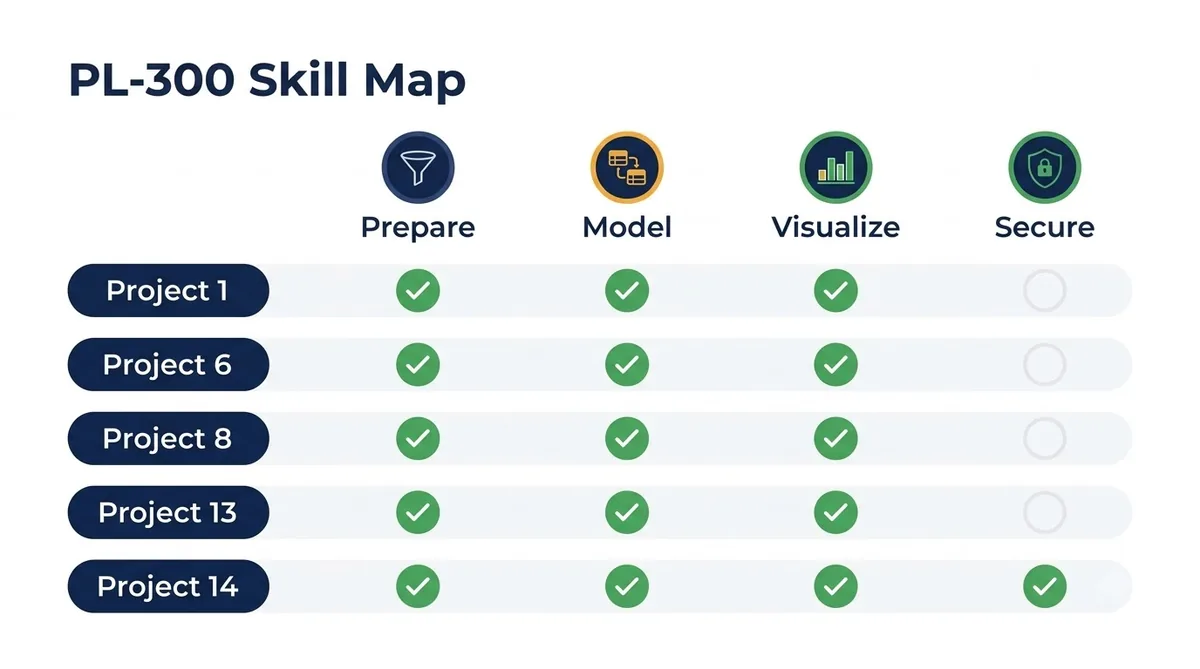
Pick three or four projects whose ticks together cover every column. Project 14 is the easiest way to fill the "Secure" column.
How to Add Power BI Projects to Your Resume
Add Power BI projects to your resume in a dedicated "Projects" section with one or two bullets each, written as outcomes, not tasks. Put this section above education if you are a fresher.
Use the 4-part resume bullet:
- Action verb: Built, Modelled, Quantified, Segmented
- What you built: a Power BI dashboard, a star schema, an RLS report
- Scale or technique: "51,717 records", "YoY and rolling-average measures"
- Finding or result: the number and what it means
Weak: "Made a sales dashboard in Power BI using charts and slicers."
Stronger: "Rebuilt a flat sales file into a 4-table star schema in Power BI and created YoY and margin measures, showing that the Government segment delivered [X]% of profit."
Three more rules:
- Link every project. Add a GitHub, LinkedIn or portfolio link next to the project name.
- Match the job. Applying for a finance role? Lead with the RBI or UPI project. For e-commerce, lead with BigBasket or RFM.
- Be ready to explain. Interviewers often ask you to walk through your data model and one DAX measure. Practise with our Power BI interview questions guide and our SQL joins guide, since many Power BI roles also test SQL.

How to Share Your Power BI Portfolio Safely
Sharing a Power BI portfolio needs some planning, because the free tools have limits that most project guides skip.
Limit 1: consumer email addresses do not work for the Power BI service. Microsoft's sign-up guidance asks for a work or school email address, and consumer addresses such as gmail.com or outlook.com are not accepted. Power BI Desktop still works without signing in, so you can build everything locally.
Limit 2: Publish to web is public. Anyone with the link can view a published report without signing in. Use it only with open data such as Kaggle, NPCI or RBI files. Never publish a client's or employer's data this way.
Limit 3: publishing to the Power BI service needs a licence. Check Microsoft's current licensing page for what your account can publish before you plan around it.
So what should a student do? Use these free options, in this order:
| Option | Cost | Best for |
|---|---|---|
| Screenshots plus a short screen recording in a GitHub README | Free | Everyone; works without any Power BI account |
| Uploading the .pbix file to GitHub | Free | Letting interviewers open your model and DAX |
| LinkedIn post with a 60-second video walkthrough | Free | Visibility with recruiters |
| Publish to web | Needs a work or school account and a licence | Open-data projects only |

If your college or institute provides a work or school Microsoft account, ask whether Power BI is enabled on it.
Which Projects Should You Build First?
Build three to five Power BI projects first, chosen by your target role, and stop adding projects once each one passes the 3-Proof Rule. Dataquest's project guide makes a similar point, suggesting that three to five projects is enough to start applying.
| Your goal | Build these first |
|---|---|
| First data analyst job (any industry) | 1, 6 and 14 |
| BFSI or fintech roles | 1, 8 and 13 |
| E-commerce or retail roles | 2, 5 and 10 |
| HR analytics roles | 3, 14 and 15 |
| Freelancing for local businesses | 4, 15 and 14 |
A practical four-week plan for a fresher:
- Week 1: Project 1 (learn the full workflow on clean data)
- Week 2: One Indian dataset project (6, 7, 8 or 9)
- Week 3: Project 14 (adds RLS and executive design)
- Week 4: Polish all three: README, screenshots, resume bullets, LinkedIn post
Want feedback on your projects from working analysts? Fireblaze's AI-Powered Data Analytics programme includes guided projects. Compare costs in our Power BI course fees guide for Nagpur. For more ideas that combine SQL and Excel, see our data analytics projects for beginners. When you are ready to apply, read about Power BI developer jobs in Nagpur.
Now It's Your Turn
You now have 15 Power BI project ideas, free datasets for each, a resume bullet template you can adapt and a safe way to share your work.
Pick three projects that match your target role, make sure each passes the 3-Proof Rule, and write every resume bullet as an outcome. Which project will you start with?
FAQ
How many Power BI projects do I need for my resume?
Three to five Power BI projects are enough for most fresher and junior roles. Pick projects that together cover data preparation, modelling, visualisation and security, and make sure each one has a clear business question and a written insight.
What are good Power BI projects for beginners?
Good beginner projects use clean data: a sales and profit dashboard on Microsoft's Financial Sample, a retail store report on the Retail Analysis sample, or an HR attrition dashboard on the IBM HR dataset. Move to Indian datasets such as UPI or Zomato once you are comfortable.
Where can I get free datasets for Power BI projects?
You can get free datasets from Microsoft's Power BI samples, Kaggle, data.gov.in, RBI's Database on Indian Economy, NPCI's UPI statistics and Maven Analytics' Data Playground. Check the licence before publishing anything publicly.
Can I do Power BI projects for free?
Yes. Power BI Desktop is free and works without signing in, so you can build every project in this list at no cost. Sharing through the Power BI service needs a work or school account, so many students share screenshots, videos and .pbix files on GitHub instead.
Should I use Publish to web for my portfolio?
Use Publish to web only for projects built on public data. Anyone with the link can view a published report without signing in, so never use it for client, employer or personal data.
Do Power BI projects help with the PL-300 certification?
Yes. The PL-300 exam covers preparing data, modelling, visualising and securing Power BI, which are the skills these projects practise. Project 14 covers row-level security, a topic many learners skip.
Sources
- Microsoft Learn: Power BI sample datasets
- Microsoft Learn: Publish to web from Power BI
- Microsoft Learn: Troubleshoot signing up for a Power BI individual license
- Microsoft Learn: Study guide for Exam PL-300, Microsoft Power BI Data Analyst
- data.gov.in: Open Government Data Platform India
- Reserve Bank of India: Database on Indian Economy
- NPCI: UPI monthly metrics
- Maven Analytics: Data Playground
- Kaggle datasets: IBM HR Attrition, Telco Churn, BigBasket, Zomato Bangalore, Air Quality India, IPL Complete, Superstore, Marketing Analytics, DataCo Supply Chain
- Dataquest: 15 Power BI project ideas to build your portfolio