 Fireblaze
Learning Guides
How to Build a Dashboard with Power BI: Step-by-Step Tutorial (2026)
Build a dashboard with Power BI in 7 steps: get data, clean it, model it, write DAX, design the KTB layout, publish and pin. Free sample data and measures.


Most beginners open Power BI Desktop, drag a few charts onto the canvas, and call it a dashboard.
Then they try to share it, and nothing works.
In this tutorial, you'll build a real dashboard with Power BI from scratch: load free sample data, clean it, model it, write 6 copy-paste DAX measures, design a clean one-page layout, then publish and pin it in the Power BI Service.
You'll also see:
- The difference between a report and a dashboard (most tutorials skip this)
- The "KTB layout" used to keep every dashboard readable
- The work-email requirement that stops many students from publishing, and what to do about it
It's a Power BI dashboard tutorial for beginners, so you don't need any prior experience. Every step here ends with something you can show a recruiter.
Let's get started.
A dashboard with Power BI is a single-page canvas in the Power BI Service made of tiles that you pin from one or more published reports. You build the visuals in Power BI Desktop, publish the report to a workspace, then pin the most important visuals to the dashboard so decision-makers can see key numbers at a glance and click through for detail.
Quick answer: how to build a dashboard with power bi (November 2026)
- Install Power BI Desktop, which is free on Windows 10 or later.
- Load data with Get Data, then clean column types and names in Power Query.
- Build relationships in the data model and add a Date table for time-based measures.
- Write DAX measures such as Total Sales, Total Profit and Profit Margin %.
- Design one report page with KPI cards, one trend chart and one breakdown chart.
- Publish to the Power BI Service and pin visuals to a dashboard, which needs a work or school email account.
Contents
- Power BI Report vs Dashboard: What's the Difference?
- What You Need to Build a Dashboard with Power BI
- Step #1: Install Power BI Desktop
- Step #2: Get Your Data into Power BI
- Step #3: Clean the Data in Power Query
- Step #4: Build the Data Model
- Step #5: Write Your First DAX Measures
- Step #6: Design Your Dashboard with Power BI Using the KTB Layout
- Step #7: Publish and Pin Your Power BI Dashboard
- Bonus: Build a Dashboard with Power BI Faster Using Copilot
- 7 Power BI Dashboard Mistakes Beginners Make
- How to Turn This Dashboard into a Resume Project
- Now It's Your Turn
- FAQ
Power BI Report vs Dashboard: What's the Difference?
A Power BI report is a multi-page, fully interactive file you build in Power BI Desktop, while a Power BI dashboard is a single page of pinned tiles that lives only in the Power BI Service. Microsoft's own documentation states that dashboards are a feature of the Power BI service and aren't available in Power BI Desktop.
This trips up almost every beginner.
When people search "dashboard with Power BI", they usually mean a one-page summary report. That's fine. But if your manager asks for a "Power BI dashboard", they may mean the real thing: tiles pinned in the Service, with data alerts and Q&A.
Here's how the two compare:
| Feature | Power BI report | Power BI dashboard |
|---|---|---|
| Pages | One or many | Exactly one |
| Where you build it | Power BI Desktop or Service | Power BI Service only |
| Data sources | A single semantic model | Tiles from many reports and semantic models |
| Slicers and filters | Yes | No (pin a full report page to keep interactivity) |
| Data alerts on tiles | No | Yes, on card, KPI and gauge tiles |
| Best for | Analysts exploring detail | Managers monitoring key numbers |
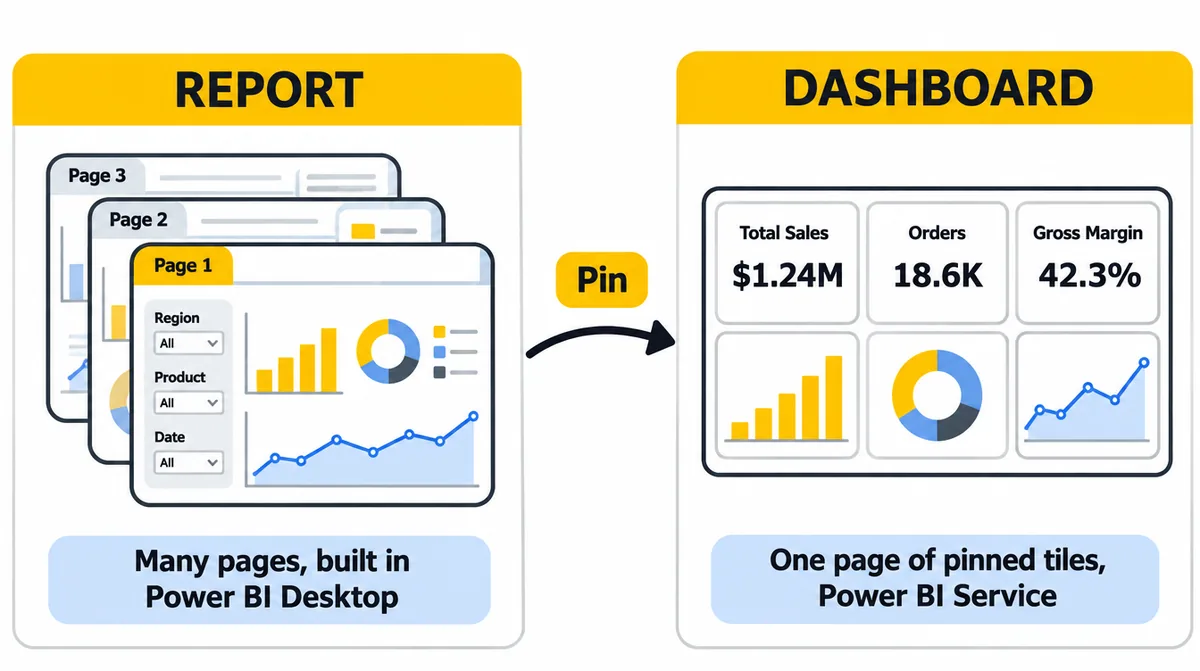
According to Microsoft Learn, dashboard tiles update as the underlying data changes, and selecting a tile usually opens the report page it came from.
So the real workflow is report first, dashboard second. This tutorial follows that order.
What You Need to Build a Dashboard with Power BI
You need three things to build a dashboard with Power BI: a Windows PC, the free Power BI Desktop app, and a dataset. You need a fourth thing, a work or school email, only for the final publish-and-pin step.
Here's the checklist:
- A Windows 10 or later PC. Microsoft's Get Power BI Desktop page lists the system requirements. There's no native Mac version.
- Power BI Desktop, which is free.
- A dataset. We'll use Microsoft's free Financial Sample Excel workbook, a single table of sales and profit data by segment, country and product.
- A work or school email for the Power BI Service.
That last point matters more than most guides admit.
Microsoft's support docs say Power BI requires a work or school email address. The service does not accept addresses from consumer email providers such as Gmail, Outlook.com or Hotmail.
Which Path Fits You? (The Account Decision Table)
The account you have decides how far you can take this tutorial:
| Your situation | What you can do | Best path |
|---|---|---|
| Student with only Gmail | Steps 1 to 6 in Desktop | Build the full one-page dashboard in Desktop, export as PDF for your portfolio |
| College email (Microsoft 365 tenant) | All 7 steps | Sign in to the Service with your college ID |
| Working professional | All 7 steps | Use your company account; ask IT if sign-up is blocked |
| Freelancer or business owner | All 7 steps | Create a Microsoft 365 business account to get a work email |
Note: Power BI Desktop itself doesn't need any login to build reports. You only hit the wall when you click Publish.
Now let's build.
Step #1: Install Power BI Desktop
Power BI Desktop is Microsoft's free Windows app for building reports. Installing it from the Microsoft Store is the easiest option, because the Store version updates automatically.
Here's how to do it:
- Open the Microsoft Store on Windows and search "Power BI Desktop".
- Click Get (or Install).
- Launch it from the Start menu.
Prefer a manual installer? Microsoft also offers a 64-bit download from its Get Power BI Desktop page. Install only one version, to avoid confusion about which one you're using.
Pro tip: Check your version under Help > About. If your screens look different from this tutorial, an update usually fixes it.
Step #2: Get Your Data into Power BI
Getting data into Power BI means connecting Power BI Desktop to a source (Excel, CSV, SQL Server, SharePoint and hundreds more) through the Get Data button on the Home ribbon.
For this tutorial, use the Financial Sample:
- Download the Financial Sample workbook from Microsoft Learn.
- In Power BI Desktop, click Home > Get data > Excel workbook.
- Select the file and click Open.
- In the Navigator window, tick the financials table.
- Click Transform Data (not Load). This opens Power Query so you can clean first.
Why Transform and not Load? Because messy data creates wrong totals later, and fixing it at the source takes seconds.
Note: In February 2026, Microsoft announced that it would retire the old Excel and CSV import option on the Service's Create page, with May 31, 2026 as the removal date. Building in Power BI Desktop, as this tutorial does, isn't affected.
Step #3: Clean the Data in Power Query
Power Query is the data-cleaning editor inside Power BI. Every change you make there is recorded as an "Applied Step" that reruns automatically on each refresh.
For the Financial Sample, do these four checks:
- Fix data types. Click the icon left of each column header. Make Units Sold a Whole Number, Sales, Profit and COGS Fixed Decimal Number, and Date a Date.
- Trim text columns. Select Segment, Country and Product, then Transform > Format > Trim to remove hidden spaces.
- Remove columns you won't use. Right-click Month Number or other helper columns and choose Remove if your dashboard won't need them.
- Rename the query to something clear, like
Financials.
When you're done, click Home > Close & Apply.
Here's why this matters: a "Sales" column stored as text can't be summed. Power BI will show it as a count instead, and your KPI card will be wrong without any error message.
Step #4: Build the Data Model
The data model is how your tables connect. The standard pattern in Power BI is a star schema: one fact table of transactions in the middle, surrounded by dimension tables like Date, Product and Country.
The Financial Sample is one flat table, so add one dimension that every dashboard needs: a Date table.
Here's how:
- Go to Modeling > New table.
- Paste this DAX:
Date Table =
ADDCOLUMNS (
    CALENDARAUTO (),
    "Year", YEAR ( [Date] ),
    "Month", FORMAT ( [Date], "MMM" ),
    "Month Number", MONTH ( [Date] )
)
- Select the new table, then Table tools > Mark as date table and pick the Date column.
- Open Model view and drag Date Table[Date] onto Financials[Date] to create a one-to-many relationship.
- Select Date Table[Month] and set Sort by column to Month Number, so months show Jan to Dec instead of alphabetically.
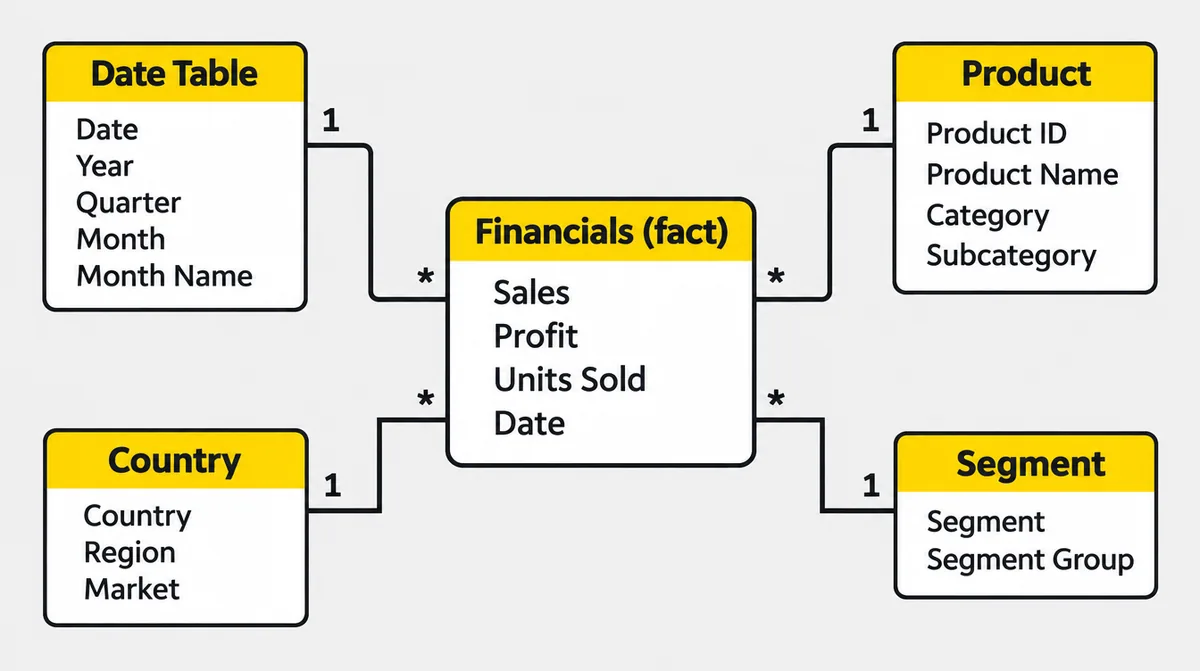
Why a separate Date table? Time-intelligence functions like SAMEPERIODLASTYEAR need a continuous, marked date table to return correct results.
Pro tip: On real projects, split Product and Country into their own tables too. Your relationships stay one-to-many, and slicers stay fast.
Step #5: Write Your First DAX Measures
DAX (Data Analysis Expressions) is Power BI's formula language. Measures are DAX calculations that recompute every time a user clicks a slicer or filter. Always use measures for KPIs instead of dragging raw columns onto visuals.
Create a blank table to hold them: Home > Enter data, name it _Measures, click Load. Then select it and use Home > New measure for each formula below.
The 6 Starter Measures (Copy and Paste)
Total Sales = SUM ( Financials[Sales] )

Total Profit = SUM ( Financials[Profit] )

Units Sold = SUM ( Financials[Units Sold] )

Profit Margin % = DIVIDE ( [Total Profit], [Total Sales] )

Sales LY =
CALCULATE ( [Total Sales], SAMEPERIODLASTYEAR ( 'Date Table'[Date] ) )

Sales YoY % = DIVIDE ( [Total Sales] - [Sales LY], [Sales LY] )
Format them right away: select Total Sales, set Currency with 0 decimals, and set both % measures to Percentage with 1 decimal.
Here's what each one answers for a manager:
| Measure | Business question |
|---|---|
| Total Sales | How much did we sell? |
| Total Profit | How much did we keep? |
| Units Sold | How much volume moved? |
| Profit Margin % | Are we selling profitably? |
| Sales LY | What did the same period look like last year? |
| Sales YoY % | Are we growing or shrinking? |
DIVIDE is used instead of the / operator because it returns blank instead of an error when the denominator is zero.
Step #6: Design Your Dashboard with Power BI Using the KTB Layout
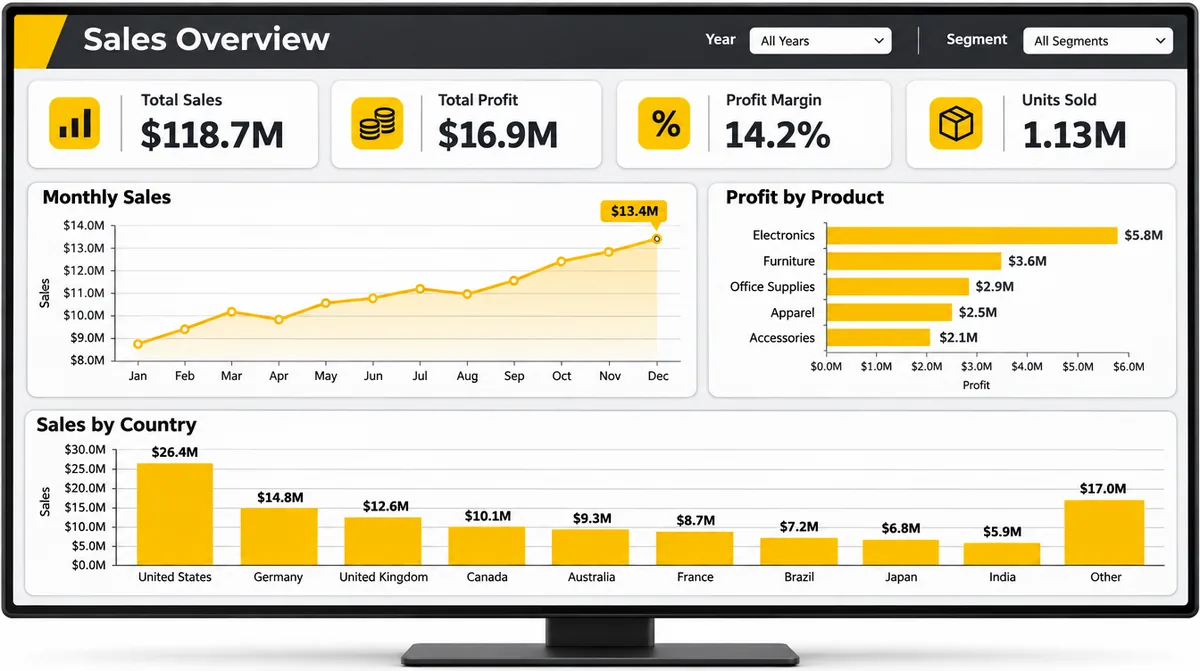
A good dashboard with Power BI answers three questions in reading order: how are we doing, how is it changing, and where is it coming from. At Fireblaze we teach this as the KTB layout (KPI, Trend, Breakdown): KPI cards on top, one trend chart in the middle, and breakdown charts at the bottom.
People scan a screen top-left to bottom-right, so the most important number goes top-left.
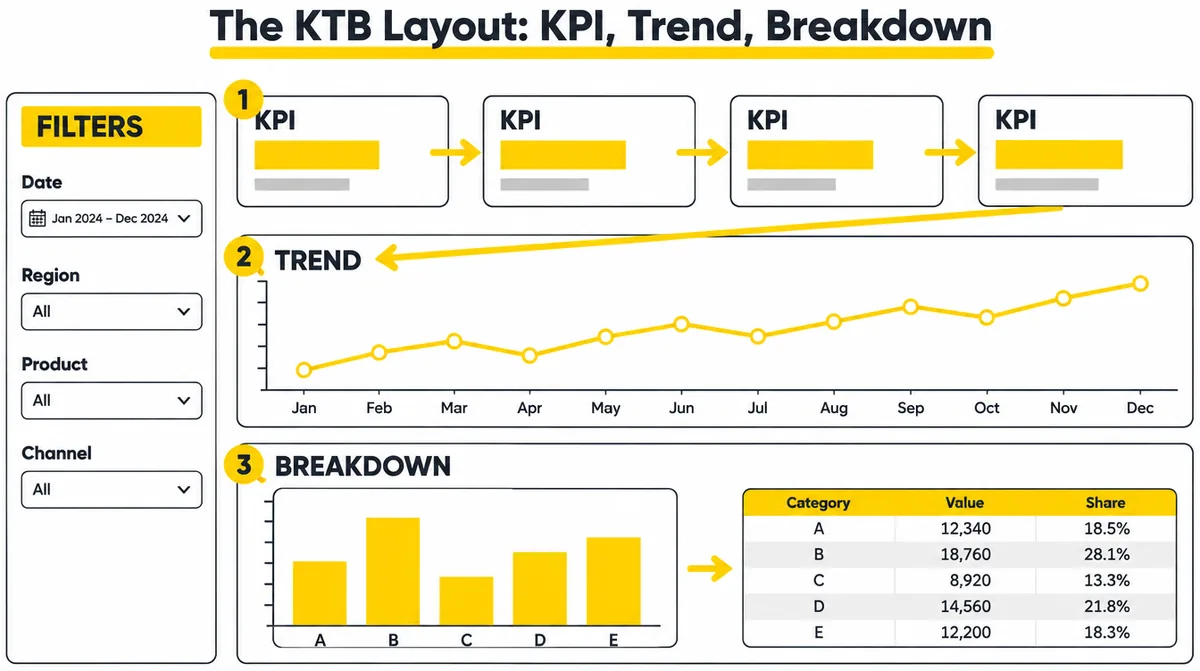
Here's how to build each zone:
Zone 1: KPI Cards
- In the Visualizations pane, select the Card visual.
- Drag Total Sales into it. Repeat for Total Profit, Profit Margin % and Sales YoY %.
- Line all four up across the top. Use Format > Align to space them evenly.
Keep it to four or five cards. More than that, and nothing stands out.
Zone 2: Trend
- Add a Line chart.
- Put Date Table[Month] on the X-axis and Total Sales on the Y-axis.
- Add Date Table[Year] to Legend to compare years.
Zone 3: Breakdown
- Add a Clustered bar chart with Product on the Y-axis and Total Profit on the X-axis. Sort descending.
- Add a Clustered column chart with Country and Total Sales.
Zone 4: Filters
- Add a Slicer for Year and another for Segment.
- Set the slicer style to Tile or Dropdown in the Format pane to save space.
Make It Look Professional in 5 Minutes
Formatting turns a working page into one people trust. Do these five things:
- Apply one theme: View > Themes, pick one, and don't mix colors by hand.
- Use one accent color for the number you want noticed. Grey for everything else.
- Remove chart clutter: turn off gridlines and unneeded axis titles in Format.
- Give every visual a clear title like "Profit by Product", not "Sum of Profit by Product".
- Build a phone layout: View > Mobile layout, then drag your KPI cards and trend chart onto the phone canvas.
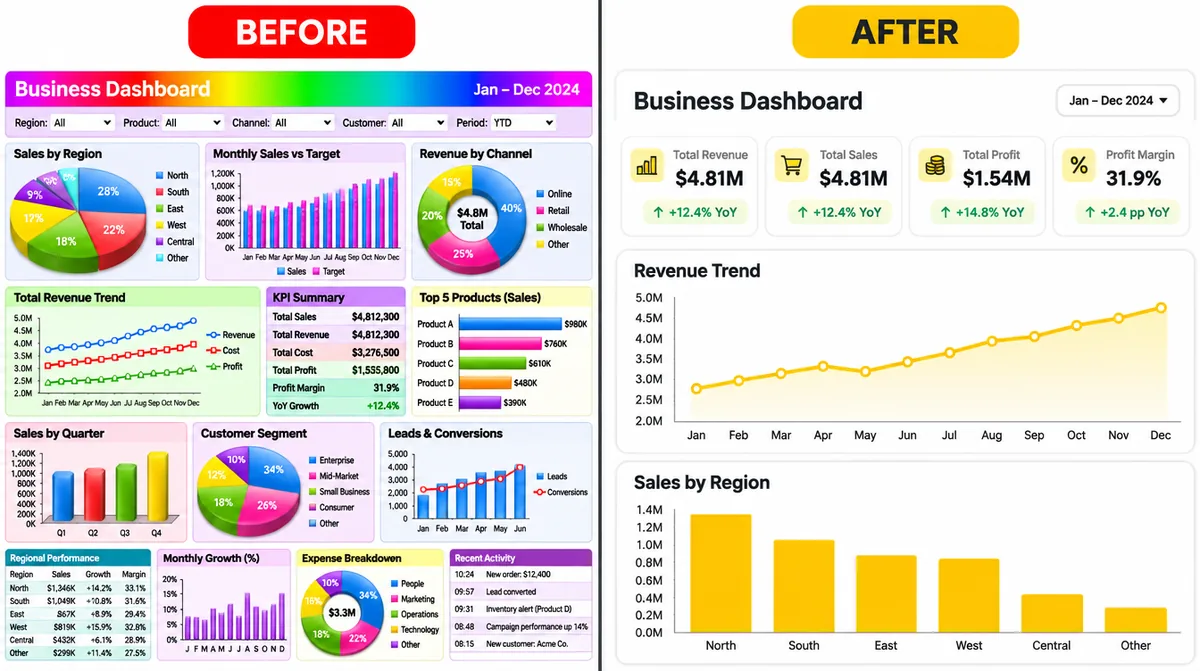
Here's what a finished page can look like:
Step #7: Publish and Pin Your Power BI Dashboard
Publishing sends your report and its semantic model from Power BI Desktop to a workspace in the Power BI Service. Pinning is how you turn report visuals into dashboard tiles. This is the step where your report becomes a true Power BI dashboard.
Here's how to do it:
- Save your file (File > Save) as a .pbix.
- Click Home > Publish and sign in with your work or school account.
- Pick a workspace (start with My workspace) and click Select.
- Click the link to open the report in the Power BI Service.
- Hover over the Total Sales card and click the pin icon.
- Choose New dashboard, name it "Sales Overview", and click Pin.
- Pin the other visuals to the Existing dashboard you just created.
- Open the dashboard from your workspace and drag tiles into the KTB order.
Want slicers to keep working? Pin the whole report page instead of single visuals. Microsoft's dashboard documentation describes pinning a report page as the way to keep the report's interactivity on a dashboard.
Sharing: What It Can Cost
Sharing a dashboard with colleagues usually needs a paid per-user license on both the publishing and viewing side. Power BI Pro is priced per user per month, billed yearly, with GST extra in India. Check the current India rate on Microsoft's Power BI pricing page before you budget. Building and publishing to My workspace for yourself works on a free license.
Important: Avoid Publish to web for company data. It creates a public link anyone can open.
Bonus: Build a Dashboard with Power BI Faster Using Copilot
Copilot in Power BI is Microsoft's AI assistant that can create and edit report pages from natural-language prompts in both Power BI Desktop and the Service.
For example, a prompt like "Create a page showing sales by month and profit by product with a slicer for segment" can produce a first draft page in seconds.
But there's a catch. Copilot needs a paid Fabric or Power BI Premium capacity, and it is not included with a free or Pro license alone. Check the minimum capacity size in the requirements section of Microsoft's Copilot overview, because older guides still quote F64. Most students and small businesses won't have that capacity, so learn the manual steps first. Copilot also only works well on a clean, well-named model, which is exactly what Steps 3 to 5 give you.
7 Power BI Dashboard Mistakes Beginners Make
Beginners building their first Power BI dashboard make the same seven mistakes again and again, and each one has a quick fix:
- Calling a report a dashboard. Know the difference so you can answer the interview question confidently.
- Dragging raw columns instead of measures. Measures stay correct under every filter. Implicit sums don't.
- Skipping the Date table. Year-over-year math breaks without it.
- Too many visuals. If a page has more than 8 visuals, split it.
- Rainbow colors and 3D charts. They look busy and hide the message.
- Pie charts with 10 slices. Use a sorted bar chart instead.
- No mobile layout. Many managers open dashboards on their phones first.
How to Turn This Dashboard into a Resume Project
A Power BI dashboard becomes a strong resume project when it solves a stated business question, uses a real-looking dataset, and is easy for a recruiter to see in under a minute.
Here's how to package it:
- Swap the dataset for an Indian one (retail sales, IPL stats or state-wise data) so your project isn't identical to everyone else's.
- Write a 3-line problem statement on the page itself: business question, data, key insight.
- Export a PDF (File > Export > Export to PDF) and add it to your LinkedIn Featured section.
- Record a 60-second screen walkthrough explaining one insight.
- Prepare for questions on report vs dashboard, DAX measures and relationships.
Practise with these Power BI interview questions and our data analyst interview questions. Most analyst roles also test SQL, so keep these SQL interview questions handy.
Now It's Your Turn
You now know how to create a dashboard in Power BI the right way: clean data in Power Query, a star-schema model, DAX measures, the KTB layout, then publish and pin.
Start with the Financial Sample today, then rebuild it with your own data this week.
Want guided practice on real business datasets with trainer feedback? Explore our Power BI course in Nagpur, or check data analyst course fees first.
Which zone of the KTB layout will you build first in your next dashboard with Power BI?
About the Author
Aniruddha Abhay Kalbande is the founder of Fireblaze AI School, which he started in Nagpur on 31 October 2017. He is an Electronics and Telecommunication Engineer from Yeshwantrao Chavan College of Engineering (YCCE), Nagpur, with 10 years of experience in IT consulting and training. He has trained more than 20,000 students. The school is a NASSCOM partner for its Post Graduate Program in Data Science & Analytics and runs classroom batches at 3 Nagpur centers alongside live online batches across Maharashtra. He writes here on career roadmaps, interview preparation and how to evaluate a training institute honestly.
Sources
- Dashboards for designers in the Power BI service, Microsoft Learn, 2026
- Dashboards for business users of the Power BI service, Microsoft Learn, 2026
- Basic concepts for designers in the Power BI service, Microsoft Learn, 2026
- Get Power BI Desktop, Microsoft Learn, 2026
- Troubleshoot signing up for Power BI, Microsoft Learn, 2026
- Download the Financial Sample Excel workbook, Microsoft Learn, 2026
- Power BI February 2026 Feature Summary, Microsoft Power BI Blog, 2026
- Create and edit Power BI reports with Copilot, Microsoft Learn, 2026
- Overview of Copilot for Power BI, Microsoft Learn, 2026
- Power BI pricing (India), Microsoft
FAQ
Frequently Asked Questions
How do I create a dashboard with Power BI for free?
You can build the full one-page report for free in Power BI Desktop on Windows, then publish it and pin visuals in the Power BI Service using a work or school email. Pinning to your own My workspace works on a free license, while sharing with others usually needs Power BI Pro.
Can I create a Power BI dashboard in Power BI Desktop?
No. Microsoft states that dashboards are a Power BI Service feature and aren't available in Power BI Desktop. In Desktop you build report pages, which many people informally call dashboards, and then pin them to a dashboard after publishing.
How long does it take to build a Power BI dashboard?
A simple one-page dashboard on clean sample data takes about 1 to 2 hours for a beginner following this tutorial. Real business dashboards take longer because most of the time goes into cleaning data and agreeing on which KPIs matter.
Do I need to know DAX to build a Power BI dashboard?
You need only basic DAX to start. Five or six measures like SUM, DIVIDE and CALCULATE cover most beginner dashboards. Learn time intelligence and filter context next, as they come up in almost every analyst interview.
Can I use Power BI with a Gmail account?
You can download and use Power BI Desktop without any account. However, Microsoft does not accept Gmail, Outlook.com or other consumer email addresses for the Power BI Service, so you can't publish or create dashboards with them. Use a college, company or Microsoft 365 business email instead.
Keep Reading
Related Articles
Interview Preparation
75 Power BI Interview Questions and Answers (2026)
75 Power BI interview questions with answers for freshers and experienced candidates: DAX, Power Query, data modeling, row-level security, s
Choosing a Course
Data Analyst Course Fees India 2026: Free, Online, Classroom
Data analyst course fees in India for 2026: free, online and classroom options compared, with hidden costs, GST, EMI and a five-point test.
Learning Guides
Power BI vs Tableau: Which Tool Should You Learn in 2026?
Choosing between Power BI and Tableau can be challenging, especially for aspiring data analysts and business intelligence professionals. Bot