 Fireblaze
 Learning Guides
What is the P-Value? A Complete Beginner’s Guide (EP-05)
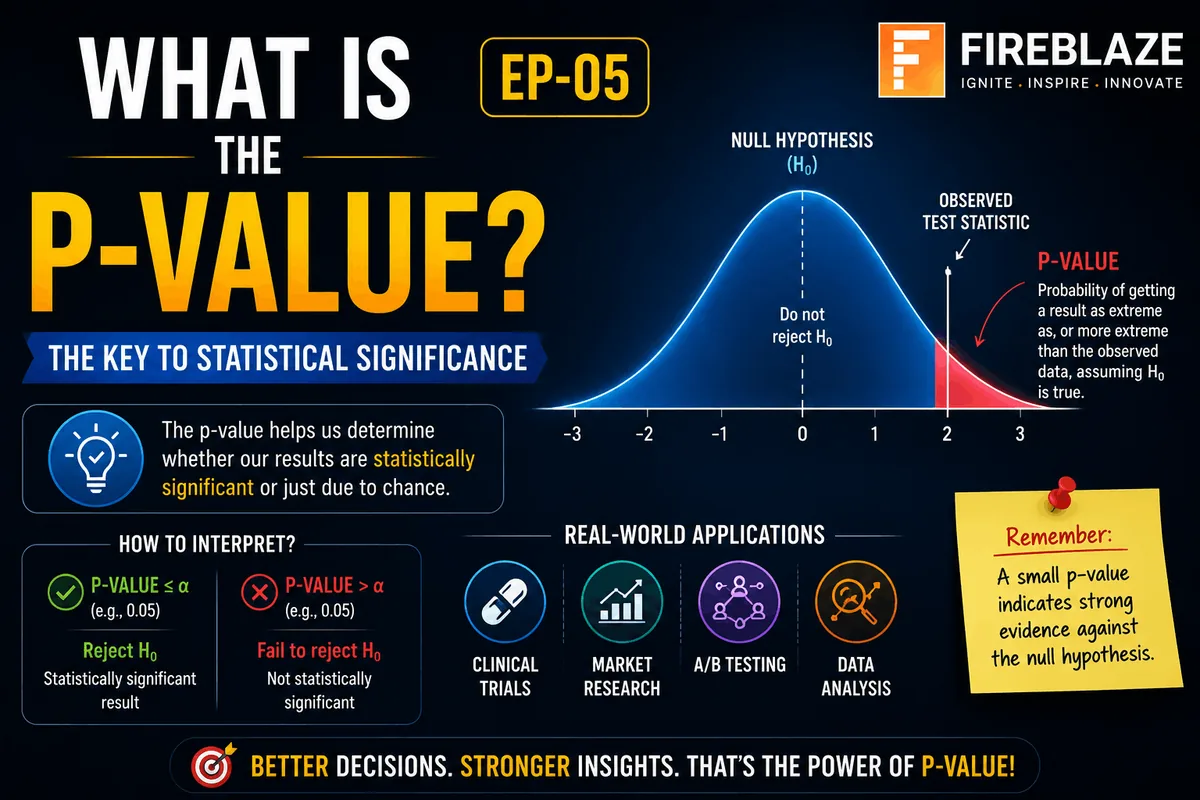
Statistics plays a crucial role in Data Science, Machine Learning, Artificial Intelligence, Business Analytics, and scientific research. One of the most frequently discussed concepts in statistics is the:
P-Value
If you've ever worked with hypothesis testing, research papers, A/B testing, or machine learning models, you've probably encountered the term P-value.
However, many beginners find it confusing.
Questions such as:
What exactly is a P-value?
Why is it important?
How is it calculated?
What does a P-value of 0.05 mean?
are extremely common.
In this guide, you'll learn everything you need to know about the P-value in a simple and practical way.
What is a P-Value?
A P-value is a statistical measure used to determine whether the results observed in a dataset are statistically significant.
In simple words:
The P-value tells us how likely it is that the observed result occurred by chance.
It helps analysts decide whether they should accept or reject a hypothesis.
Why Do We Need the P-Value?
Imagine a company launches a new marketing campaign.
After one month, sales increase by 10%.
Now the company wants to know:
Did the campaign actually improve sales?
Or was the increase simply due to random chance?
The P-value helps answer this question.
Understanding Hypothesis Testing
Before understanding the P-value, we need to understand:
Hypothesis Testing
Hypothesis testing involves two assumptions.
Null Hypothesis (H₀)
The null hypothesis assumes:
There is no effect or no difference.
Example:
"The marketing campaign had no impact on sales."
Alternative Hypothesis (H₁)
The alternative hypothesis assumes:
There is an effect or a difference.
Example:
"The marketing campaign increased sales."
Role of the P-Value
The P-value helps determine whether we have enough evidence to reject the null hypothesis.
Smaller P-values indicate stronger evidence against the null hypothesis.
How to Interpret a P-Value
The most commonly used significance level is:
0.05
This is known as Alpha (α).
Case 1: P-Value < 0.05
Example:
P = 0.02
Interpretation:
Result is statistically significant.
Reject the null hypothesis.
Evidence supports the alternative hypothesis.
Case 2: P-Value > 0.05
Example:
P = 0.12
Interpretation:
Result is not statistically significant.
Fail to reject the null hypothesis.
Evidence is insufficient.
Understanding Significance Level
The significance level represents the acceptable probability of making an incorrect conclusion.
Common values:
| Significance Level | Confidence Level |
|---|---|
| 0.10 | 90% |
| 0.05 | 95% |
| 0.01 | 99% |
Most Data Science applications use:
α = 0.05
Real-World Example
Suppose a pharmaceutical company develops a new medicine.
The company wants to know whether the medicine performs better than the existing treatment.
Hypotheses:
Null Hypothesis
The medicine has no effect.
Alternative Hypothesis
The medicine improves patient outcomes.
After conducting a clinical trial:
P = 0.01
Interpretation:
There is only a 1% probability that the observed improvement happened by chance.
Therefore:
Reject the Null Hypothesis
The medicine is considered statistically effective.
Visualizing the P-Value
Think of the P-value as a measure of surprise.
If an event is very unlikely under the null hypothesis, it becomes surprising.
The smaller the P-value:
The more surprising the result
The stronger the evidence against H₀
Common P-Value Thresholds
| P-Value | Interpretation |
|---|---|
| > 0.05 | Not Significant |
| < 0.05 | Significant |
| < 0.01 | Highly Significant |
| < 0.001 | Very Highly Significant |
P-Value in Data Science
Data Scientists frequently use P-values during:
Feature Selection
A/B Testing
Experiment Analysis
Statistical Modeling
Research Studies
Example: Feature Selection
Suppose you're building a machine learning model.
You want to know whether:
Age
is related to customer purchases.
If:
P < 0.05
Age is considered statistically important.
If:
P > 0.05
Age may not contribute significantly.
P-Value in A/B Testing
A/B Testing compares two versions of a product.
Example:
Old Website
New Website
Goal:
Determine whether the new version improves conversion rates.
If:
P < 0.05
The new version is considered significantly better.
P-Value in Machine Learning
Machine Learning models often use statistical methods to evaluate relationships between variables.
Examples:
Linear Regression
Logistic Regression
Statistical Feature Selection
P-values help identify important predictors.
Common Misconceptions About P-Values
Many beginners misunderstand the P-value.
Let's clear some myths.
Myth 1
P-value tells the probability that the hypothesis is true.
Incorrect.
The P-value only measures how compatible the observed data is with the null hypothesis.
Myth 2
P > 0.05 means the hypothesis is false.
Incorrect.
It simply means there is not enough evidence to reject the null hypothesis.
Myth 3
A small P-value means the effect is large.
Incorrect.
Statistical significance and practical significance are different concepts.
Statistical Significance vs Practical Significance
Consider an e-commerce website.
A new design increases conversion rates by:
0.1%
The sample size is extremely large.
Result:
P < 0.001
Statistically significant.
However:
A 0.1% increase may not have meaningful business value.
Therefore:
Statistical significance ≠ Practical significance
Both should be considered.
Steps in Hypothesis Testing
Step 1
Define hypotheses.
Step 2
Select significance level.
Example:
α = 0.05
Step 3
Collect data.
Step 4
Perform statistical test.
Examples:
T-Test
Z-Test
Chi-Square Test
ANOVA
Step 5
Calculate P-value.
Step 6
Make decision.
If:
P < α
Reject H₀
Otherwise:
Fail to reject H₀
Common Statistical Tests Using P-Values
T-Test
Used to compare two groups.
Example:
Male vs Female Income
Chi-Square Test
Used for categorical variables.
Example:
Product Preference by Gender
ANOVA
Used to compare multiple groups.
Example:
Comparing performance of three marketing campaigns
Regression Analysis
Used to identify significant predictors.
Advantages of Using P-Values
Benefits include:
Objective decision-making
Scientific validation
Improved experiment analysis
Better business insights
Stronger research conclusions
Limitations of P-Values
P-values are useful but not perfect.
Limitations include:
Sensitive to sample size
Can be misinterpreted
Do not measure effect size
Should not be used alone
Analysts should combine P-values with:
Confidence Intervals
Effect Sizes
Domain Knowledge
Interview Questions on P-Value
What is a P-value?
A statistical measure that indicates how likely observed results occurred by chance.
What does a P-value of 0.03 mean?
There is a 3% probability of observing the result if the null hypothesis is true.
What happens if P-value is less than 0.05?
The result is considered statistically significant and the null hypothesis is rejected.
What is the relationship between P-value and hypothesis testing?
The P-value helps determine whether to reject or fail to reject the null hypothesis.
Why Every Data Scientist Should Understand P-Values
P-values are used extensively in:
Data Science
Machine Learning
Artificial Intelligence
Business Analytics
Healthcare Research
Financial Analysis
Understanding them helps professionals:
Make better decisions
Validate findings
Interpret experiments correctly
Build more reliable models
Final Thoughts
The P-value is one of the most fundamental concepts in statistics and Data Science. It helps determine whether observed results are statistically significant and provides a framework for making evidence-based decisions.
While the P-value is extremely useful, it should never be interpreted in isolation. Combining statistical significance with business context, effect size, confidence intervals, and domain expertise leads to more meaningful and reliable conclusions.
For aspiring Data Scientists, mastering concepts like P-values, hypothesis testing, probability, and statistical inference is essential for building a strong foundation in analytics and machine learning.
Keep Reading
Related Articles
Learning Guides
Introduction to Computer Vision: A Beginner’s Guide
Discover the basics of Computer Vision, a rapidly growing field of Artificial Intelligence that enables machines to understand images and videos. Expl
All About PyCaret: Conversation with Mr. Moez Ali and Mr. Aniruddha Kalbande | EP-06
Explore PyCaret and its impact on machine learning development through an insightful conversation with PyCaret creator Moez Ali and AI expert Aniruddh
What is Data Mining? Complete Guide for Beginners
Learn what Data Mining is, how it works, key techniques, tools, applications, advantages, challenges, and its role in Data Science, Machine Learning,