 Fireblaze
Learning Guides
Support Vector Machine in Machine Learning: SVM Explained Simply (2026)
Learn the support vector machine in machine learning: margins, support vectors, kernels, the C parameter and tested Python code that hit 97.7%.

SVM sounds scary. Hyperplanes, kernels, margins.
But the core idea fits in one sentence: draw the widest possible road between two groups.
In this guide you'll learn the support vector machine in machine learning with simple pictures, Python code we actually ran, and benchmark results that show the one setting beginners always forget.
You'll also see:
- What "support vectors" really are (it's only a few points)
- How the kernel trick separates data a straight line can't
- Our test where skipping scaling cost 6.3 accuracy points
Let's dive in.
A support vector machine in machine learning is a supervised algorithm (SVM for short) that classifies data by finding the hyperplane, a line in 2D or a flat surface in higher dimensions, that separates the classes with the widest possible margin. The few training points closest to that boundary are the support vectors, and they alone define it.
Quick answer: support vector machine in machine learning (November 2026)
- An SVM finds the decision boundary with the maximum margin between classes, defined only by the closest points, called support vectors.
- Kernels such as RBF let an SVM separate data that no straight line can split.
- Scikit-learn's SVC uses the RBF kernel and C = 1.0 by default, and its fit time grows at least quadratically with the number of samples.
- In our 5-fold test on the breast cancer dataset (569 samples), SVC scored 91.4% without scaling and 97.7% with StandardScaler.
- Cortes and Vapnik published the soft-margin SVM in the journal Machine Learning in 1995.
Contents
- What Is a Support Vector Machine in Machine Learning?
- Hyperplane, Margin and Support Vectors
- The Kernel Trick: When a Straight Line Isn't Enough
- The C Parameter: Soft vs Hard Margin
- Support Vector Machine in Machine Learning: Python Code We Tested
- Our Benchmark: Why SVM Needs Scaling
- All 4 Algorithms Compared
- When to Use (and Avoid) SVM
- FAQ
What Is a Support Vector Machine in Machine Learning?
A support vector machine is a supervised learning algorithm used mainly for classification, with a regression version called SVR. The SVM algorithm shines on high-dimensional data, where there are many features per row. It learns from labelled examples and draws the boundary that best separates the classes.
The modern soft-margin SVM comes from Corinna Cortes and Vladimir Vapnik at AT&T Bell Labs, who described it in their 1995 paper Support-vector networks in the journal Machine Learning as a new learning machine for two-group classification problems.
If supervised learning is new to you, start with our guide to the <a href="/blogs/types-of-machine-learning/">types of machine learning</a>.
Hyperplane, Margin and Support Vectors
An SVM separates classes with a hyperplane and pushes it to sit exactly in the middle of the widest possible gap, called the margin. The training points that touch the edges of that gap are the support vectors.
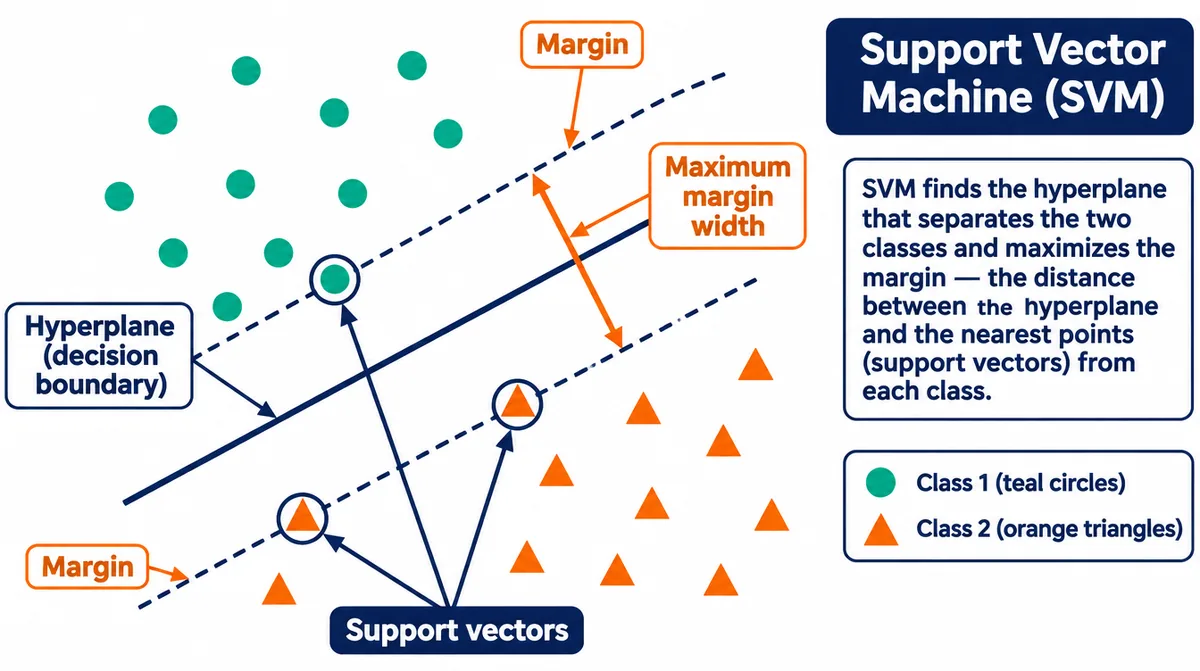
Here's a support vector machine example from everyday life: think of building the widest possible road between two villages. The houses right at the road's edge decide how wide it can be. The houses far away don't matter at all.
Here's what that looked like in our test. On 455 training samples, the trained SVM used 97 support vectors (51 for one class, 46 for the other). The other 358 points had no say in the final boundary.
Why a wide margin? A boundary with more breathing room is less sensitive to small changes, so it usually predicts new data better.
The Kernel Trick: When a Straight Line Isn't Enough
The kernel trick lets an SVM separate data that isn't linearly separable by implicitly mapping it into a higher-dimensional space, where a flat boundary can split it. The SVM never has to compute that new space directly, which keeps it fast.
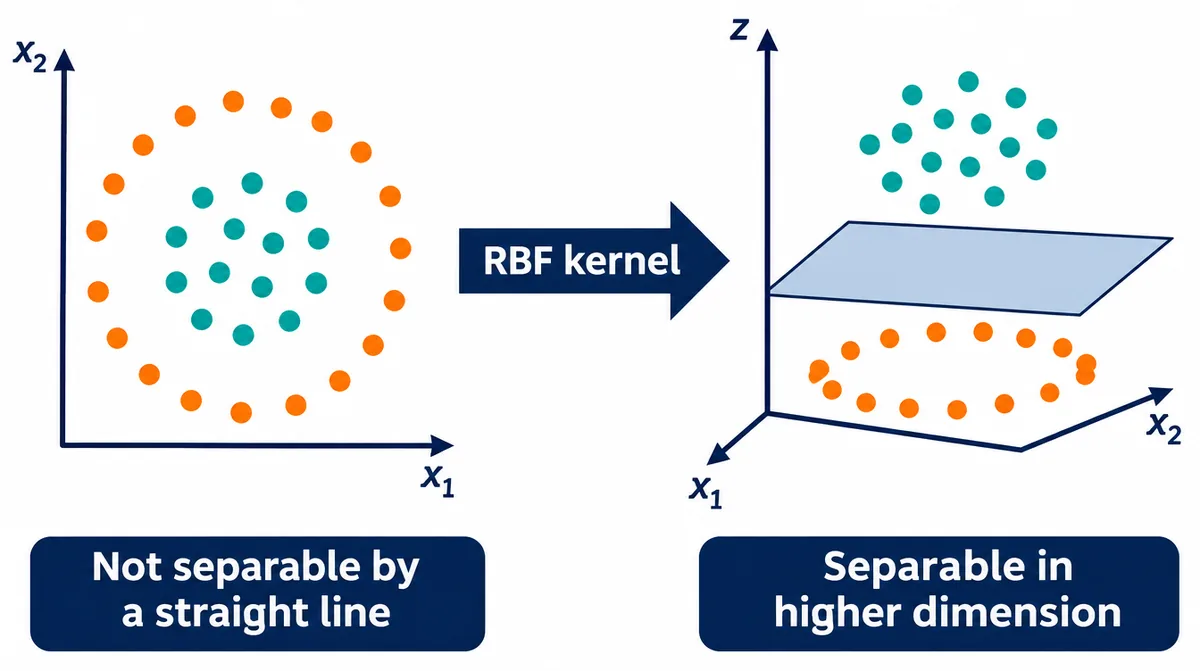
The common kernels:
| Kernel | Boundary shape | Use when |
|---|---|---|
| Linear | Straight line / flat plane | Many features, e.g. text classification |
| RBF (Gaussian) | Smooth curves and blobs | Default choice for most problems |
| Polynomial kernel | Curved, degree-based | Feature interactions matter |
| Sigmoid | Neural-network-like | Rarely used in practice |
Scikit-learn's SVC, which is built on the libsvm library, uses the RBF kernel if none is given. The gamma setting controls how far each point's influence reaches. The default gamma='scale' works well to start.
The C Parameter: Soft vs Hard Margin
The C parameter controls how much an SVM is penalised for misclassifying training points. A small C allows a wider, "softer" margin with some mistakes; a large C forces a narrow margin that tries to classify every training point correctly.
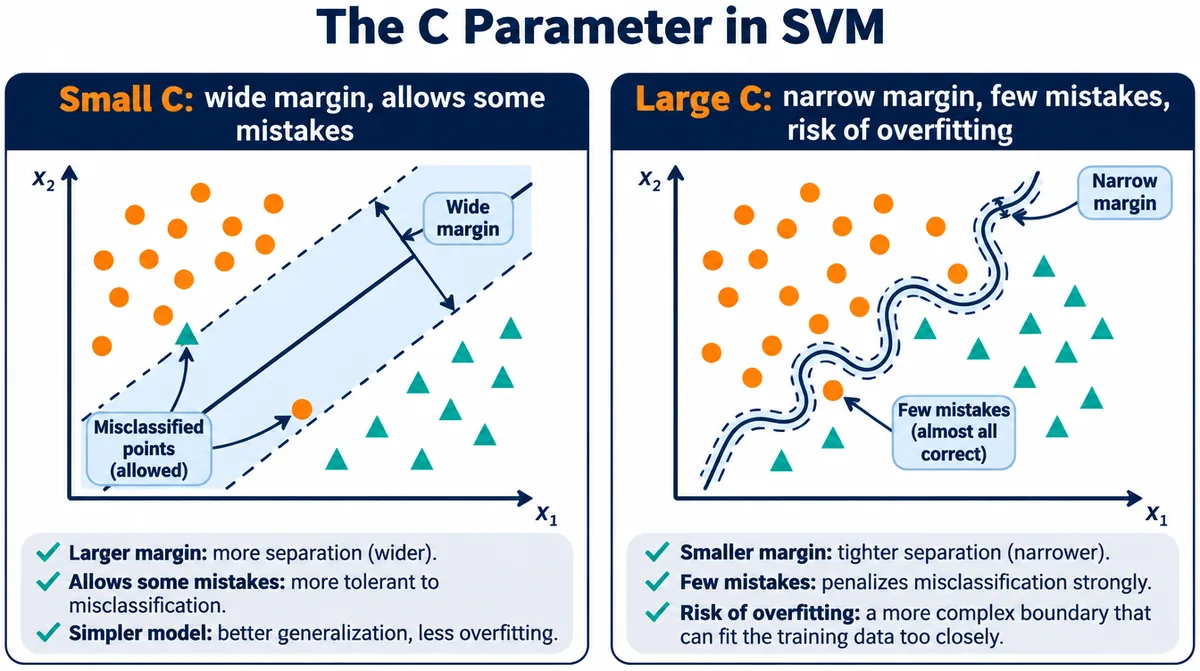
Scikit-learn's docs explain that the strength of the regularization is inversely proportional to C, with a default of 1.0.
We tested five values on the breast cancer data (scaled RBF SVC, 5-fold CV):
| C | 5-fold accuracy |
|---|---|
| 0.01 | 62.7% |
| 0.1 | 94.7% |
| 1 (default) | 97.7% |
| 10 | 97.9% |
| 100 | 95.1% |
Too small and the model barely learns. Too big and it starts overfitting. The sweet spot sits in the middle, which is why you tune C with cross-validation.
Support Vector Machine in Machine Learning: Python Code We Tested
SVM in Python takes about 12 lines with scikit-learn. We ran this with scikit-learn 1.9.1 on the built-in breast cancer dataset, which has 569 samples and 30 features.
from sklearn.datasets import load_breast_cancer
from sklearn.model_selection import cross_val_score, StratifiedKFold
from sklearn.pipeline import make_pipeline
from sklearn.preprocessing import StandardScaler
from sklearn.svm import SVC

X, y = load_breast_cancer(return_X_y=True)
cv = StratifiedKFold(n_splits=5, shuffle=True, random_state=42)

raw = SVC()                                       # no scaling
scaled = make_pipeline(StandardScaler(), SVC())   # with scaling

print(cross_val_score(raw, X, y, cv=cv).mean())     # 0.914
print(cross_val_score(scaled, X, y, cv=cv).mean())  # 0.977
Putting StandardScaler inside a make_pipeline matters. It scales each training fold separately, so no information leaks from the test fold.
Note: In the scikit-learn development docs, SVC's
probability=Trueoption is marked deprecated, to be removed in 1.11, with CalibratedClassifierCV suggested instead. Use that if you need probabilities from an SVM.
Our Benchmark: Why SVM Needs Scaling
An SVM measures distances between points, so features on large scales drown out features on small scales. Scaling puts every feature on a similar range so each one gets a fair vote.
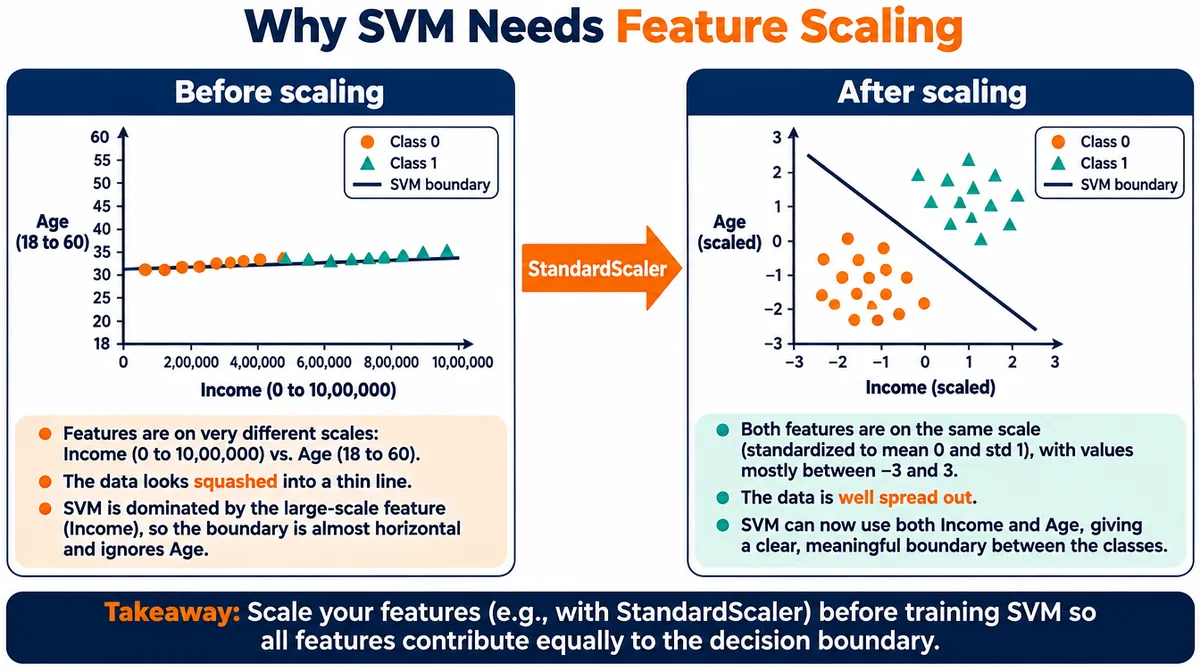
The Fireblaze ML Benchmark (scikit-learn 1.9.1, 5-fold stratified CV, random_state=42) shows the gap:
| Setup | 5-fold accuracy |
|---|---|
| SVC (RBF), raw features | 91.4% |
| StandardScaler + SVC (RBF) | 97.7% |
| StandardScaler + SVC (linear kernel) | 97.4% |
Skipping one line of preprocessing cost 6.3 accuracy points. This is the most common SVM mistake we see in beginner projects.
All 4 Algorithms Compared
The four algorithms in this series solve different problems, and our benchmark puts them side by side on the same data and settings.
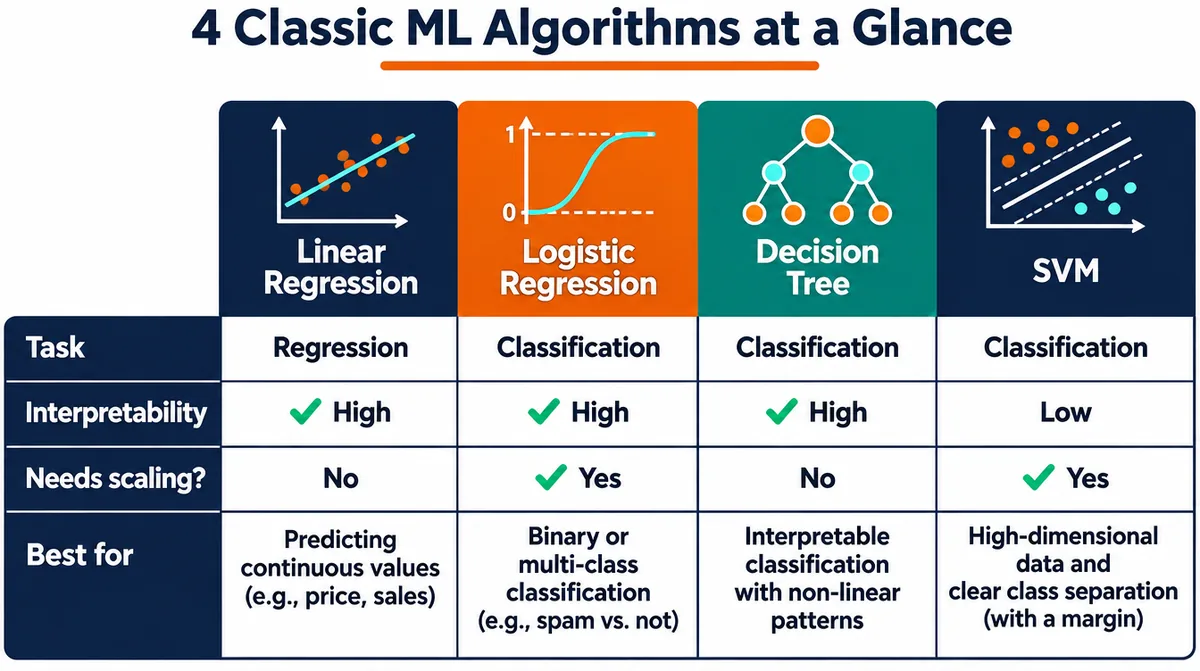
Classification on breast cancer data (569 samples, 5-fold CV):
| Model | Accuracy | Needs scaling? | Explainability |
|---|---|---|---|
| SVM (RBF + scaler) | 97.7% | Yes | Low |
| Logistic regression + scaler | 97.4% | Yes | High |
| Random forest | 95.6% | No | Medium |
| Decision tree, max_depth=5 | 92.8% | No | Very high |
| Decision tree, default | 91.0% | No | Very high |
Regression on diabetes data (442 samples, 5-fold CV): linear regression R² 0.478 vs default decision tree R² minus 0.133.
Notice that logistic regression came within 0.3 points of SVM while staying fully explainable. In many real projects, that trade-off favours logistic regression. Read the full breakdowns in our guides to linear regression in machine learning, logistic regression in machine learning and decision tree in machine learning.
When to Use (and Avoid) SVM
SVM works best on small to medium datasets with many features and a clear margin between classes. It struggles on very large datasets because training time grows quickly.
Use SVM when:
- You have hundreds to tens of thousands of rows
- Features are many, e.g. text or gene data
- You need strong accuracy and can live with low explainability
Avoid SVM when:
- You have hundreds of thousands of rows or more. Scikit-learn warns that SVC's fit time scales at least quadratically with the number of samples and may be impractical beyond tens of thousands. Use LinearSVC or SGDClassifier instead.
- Stakeholders need to understand each decision
- You need well-calibrated probabilities without extra work
Now It's Your Turn
SVM comes down to three ideas: the widest margin, a handful of support vectors and the kernel trick for curved data. Add scaling and a tuned C, and it's one of the strongest classic classifiers you can use.
Run the code above, then try C values from 0.1 to 100 yourself.
Want to master all four algorithms with real projects? Explore the <a href="/courses/data-science-certification-nagpur/">Data Science certification at Fireblaze</a>, then prepare with these machine learning interview questions.
Which dataset will you try an SVM on first?
About the Author
Aniruddha Abhay Kalbande is the founder of Fireblaze AI School, which he started in Nagpur on 31 October 2017. He is an Electronics and Telecommunication Engineer from Yeshwantrao Chavan College of Engineering (YCCE), Nagpur, with 10 years of experience in IT consulting and training. He has trained more than 20,000 students. The school is a NASSCOM partner for its Post Graduate Program in Data Science & Analytics and runs classroom batches at 3 Nagpur centers alongside live online batches across Maharashtra. He writes here on career roadmaps, interview preparation and how to evaluate a training institute honestly.
Sources
- Support-vector networks, Cortes and Vapnik, Machine Learning 20, 273 to 297, 1995
- SVC, scikit-learn documentation, 2026
- SVC (version 1.7), scikit-learn documentation, 2025
- SVC (development docs, probability deprecation), scikit-learn, 2026
- load_breast_cancer, scikit-learn documentation, 2025
- Fireblaze ML Benchmark: scikit-learn 1.9.1, 5-fold stratified cross-validation, random_state=42, run November 12, 2026
FAQ
Frequently Asked Questions
What is a support vector machine in machine learning in simple words?
SVM in machine learning is a classification algorithm that draws the widest possible boundary between two groups of data. The few points closest to that boundary, called support vectors, decide where it goes. Kernels let it draw curved boundaries when a straight line won't work.
What are support vectors?
Support vectors are the training points that lie closest to the SVM's decision boundary, on the edges of the margin. They alone define the boundary. In our test, only 97 of 455 training points were support vectors.
What is the kernel trick in SVM?
The kernel trick lets an SVM act as if the data were mapped into a higher-dimensional space, where a flat boundary can separate classes that are tangled in the original space. The RBF kernel is the most common choice and scikit-learn's default.
Why does SVM need feature scaling?
SVM relies on distances between points, so features with large values dominate those with small values. In our test, scaling raised SVM accuracy on the breast cancer dataset from 91.4% to 97.7%.
Is SVM better than logistic regression?
Not always. In our benchmark, a scaled SVM scored 97.7% and scaled logistic regression 97.4% on the same data. Logistic regression is faster and far easier to explain, so it's often the better practical choice when accuracy is close.
Keep Reading
Related Articles
Learning Guides
Linear Regression in Machine Learning: A Beginner's Guide with Python (2026)
Learn linear regression in machine learning with a simple example, the math in plain English, tested Python code, real R² scores and 6 commo
Learning Guides
Logistic Regression in Machine Learning: Explained with Python (2026)
Learn logistic regression in machine learning: the sigmoid, thresholds, confusion matrix, tested Python code with 97.4% accuracy, and why ba
Learning Guides
Decision Tree in Machine Learning: A Visual Guide with Python (2026)
Learn how a decision tree in machine learning works: nodes, Gini impurity, overfitting, pruning, tested Python code and when to switch to a