 Fireblaze
Learning Guides
Linear Regression in Machine Learning: A Beginner's Guide with Python (2026)
Learn linear regression in machine learning with a simple example, the math in plain English, tested Python code, real R² scores and 6 common mistakes.

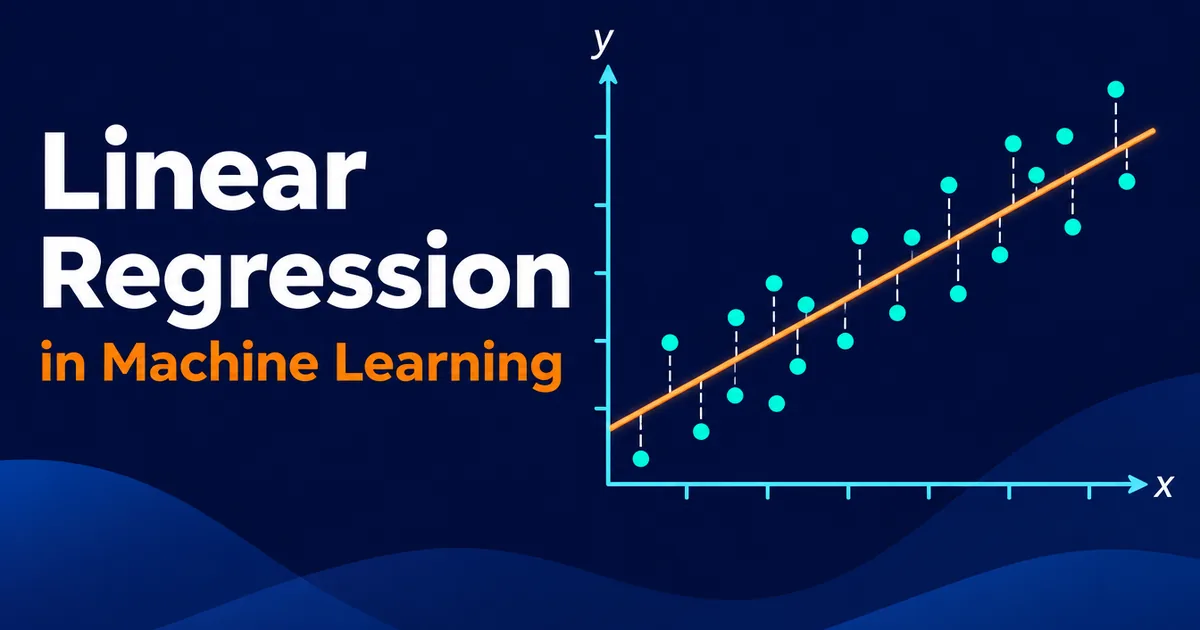
Linear regression is the first algorithm almost every data science course teaches.
And it's the one most students rush past, straight to "fancier" models.
Big mistake. In this guide you'll learn linear regression in machine learning properly: what it is, the math in plain English, Python code we actually ran, and the real scores it got.
You'll also see:
- A worked example with Indian flat prices
- Our benchmark where linear regression beat a decision tree
- The 6 mistakes that quietly ruin regression models
Let's get started.
Linear regression in machine learning is a supervised learning algorithm that predicts a continuous number (like price, sales or delivery time) by fitting a straight line, or a flat plane, through the training data. The line is chosen so the total squared distance between predicted and actual values is as small as possible.
Quick answer: linear regression in machine learning (November 2026)
- Linear regression predicts a continuous number using the equation y = b0 + b1x1 + b2x2 + ... + bnxn.
- Simple linear regression uses one input feature; multiple linear regression uses two or more.
- Scikit-learn's LinearRegression class fits the line with ordinary least squares (OLS).
- In our test on scikit-learn's diabetes dataset (442 patients, 10 features), linear regression scored an R² of 0.478 with 5-fold cross-validation.
- On the same data, a default decision tree scored an R² of minus 0.133, showing why linear regression is still a strong baseline.
Contents
- What Is Linear Regression in Machine Learning?
- A Simple Linear Regression Example
- Simple vs Multiple Linear Regression
- How Linear Regression Finds the Best-Fit Line
- The 5 Assumptions of Linear Regression
- Linear Regression in Machine Learning: Python Code We Tested
- How to Evaluate a Linear Regression Model
- Linear Regression vs Decision Trees: Our Benchmark
- 6 Linear Regression Mistakes Beginners Make
- FAQ
What Is Linear Regression in Machine Learning?
Linear regression is a supervised learning algorithm, which means it learns from examples where the correct answer is already known. It belongs to the regression family because it predicts a number, not a category.
New to these terms? Our guide to the <a href="/blogs/types-of-machine-learning/">types of machine learning</a> explains supervised learning from scratch.
Here are the key words you'll see everywhere:
| Term | Meaning | Flat price example |
|---|---|---|
| Dependent variable (y) | What you want to predict | Price in lakh |
| Independent variable (x) | The input feature | Area in sq ft |
| Intercept (b0) | Predicted y when x is 0 | Base price |
| Slope / coefficient (b1) | How much y changes per unit of x | Lakh added per extra sq ft |
| Residual | Actual y minus predicted y | Prediction error for one flat |
Scikit-learn's own documentation describes its LinearRegression class as ordinary least squares linear regression, which is the standard way to fit the line.
A Simple Linear Regression Example
A simple linear regression example uses one input to predict one output. Imagine predicting flat prices in Nagpur from carpet area alone.
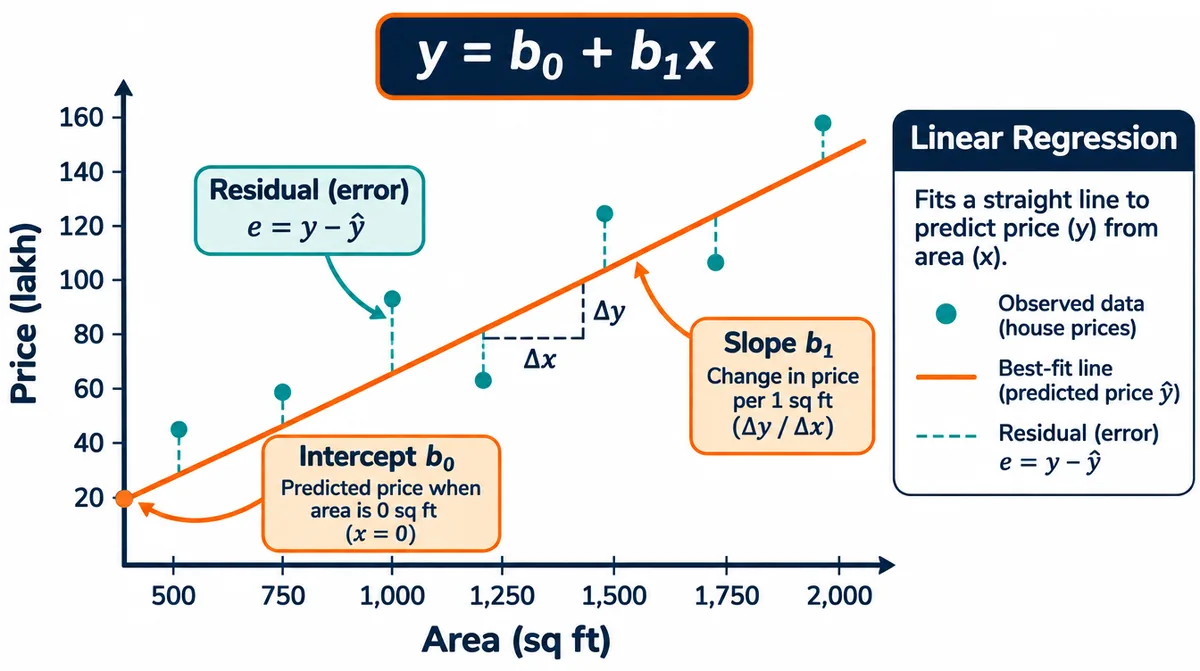
Say the model learns this equation:
Price (lakh) = 8 + 0.045 × Area (sq ft)
Then for a 900 sq ft flat:
Price = 8 + 0.045 × 900 = 8 + 40.5 = 48.5 lakh
The intercept (8) is a base value. The slope (0.045) says every extra square foot adds about ₹4,500. That's the beauty of linear regression: you can read the model like a sentence.
Note: These numbers are an illustration to explain the idea, not real Nagpur market data.
Simple vs Multiple Linear Regression
Simple linear regression uses one input feature, while multiple linear regression uses two or more features to predict the same output. Real projects almost always use multiple linear regression.
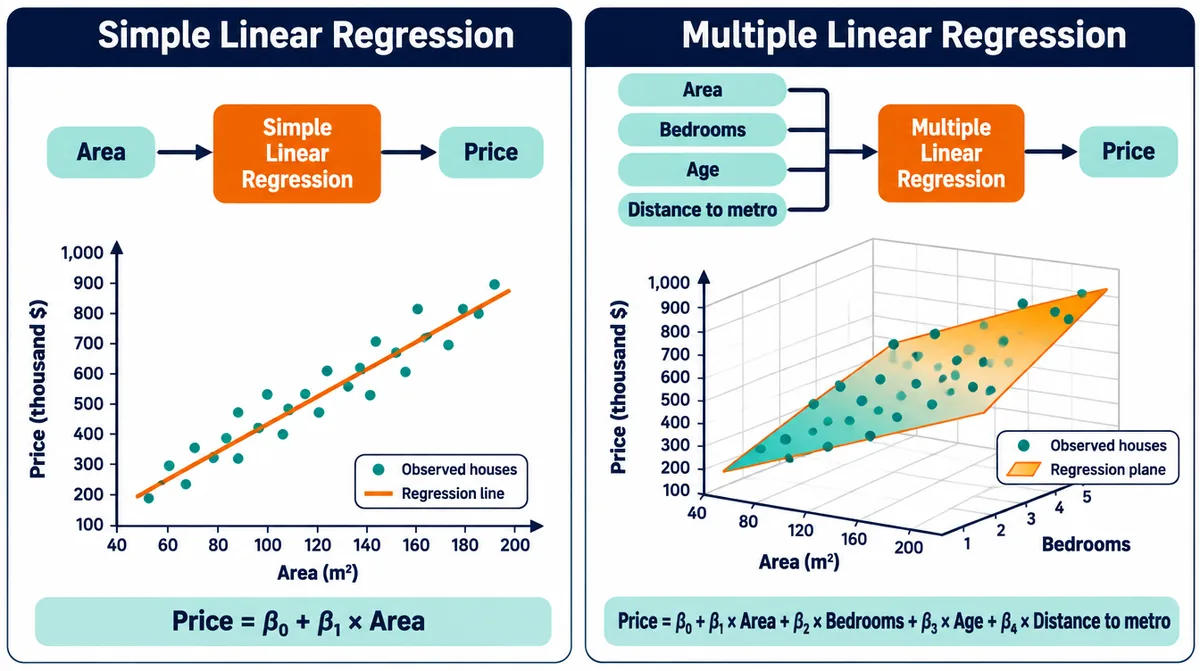
The multiple linear regression equation simply adds terms:
y = b0 + b1x1 + b2x2 + ... + bnxn
For flats, x1 could be area, x2 bedrooms, x3 age of the building and x4 distance to the metro.
Our benchmark shows why this matters. On scikit-learn's diabetes dataset, using one feature (BMI) gave a test R² of 0.233. Using all 10 features lifted it to 0.453 on the same test split.
Same algorithm. Nearly double the score.
How Linear Regression Finds the Best-Fit Line
Linear regression finds the best-fit line by choosing the slope and intercept that minimise a cost function, usually the mean squared error (MSE): the average of all squared residuals. There are two common ways to do this.
Method 1: Ordinary Least Squares (OLS)
OLS solves for the coefficients directly with linear algebra, in one step. It's exact and fast for small and medium datasets. This is what scikit-learn's LinearRegression uses, which its docs describe as plain ordinary least squares wrapped as a predictor object.
Method 2: Gradient Descent
Gradient descent starts with random coefficients and improves them step by step, always moving "downhill" on the error curve. The learning rate controls the step size.
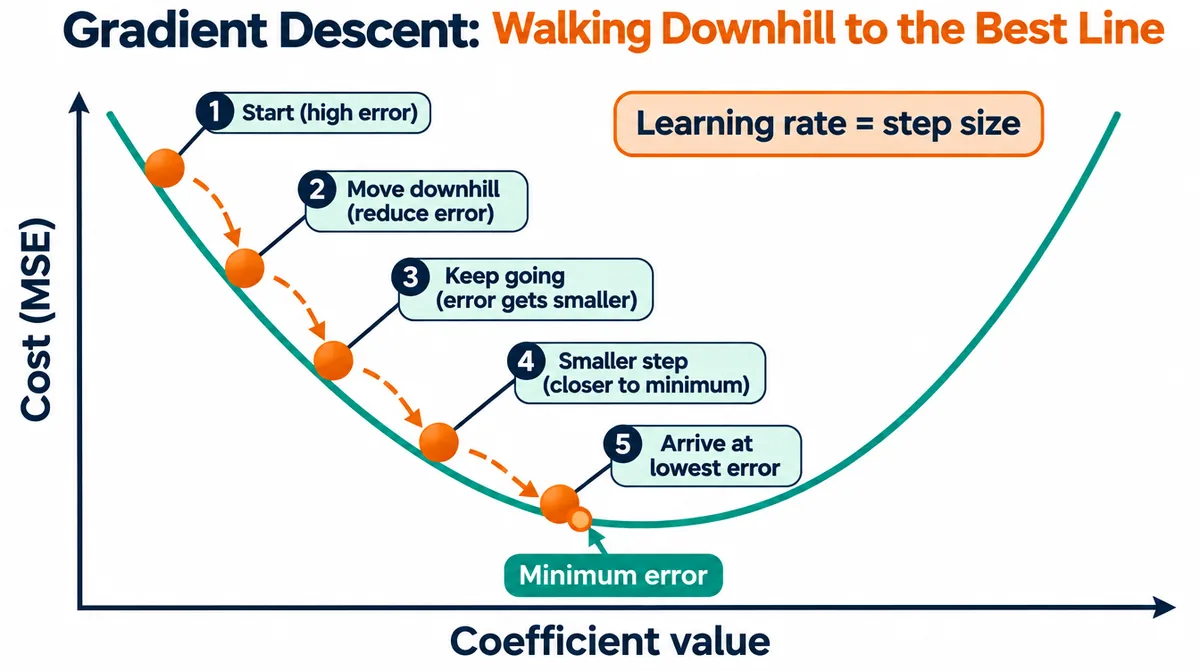
Why learn gradient descent if OLS exists? Because it scales to huge datasets and it's the same idea that trains neural networks. Interviewers love this question.
The 5 Assumptions of Linear Regression
Linear regression gives reliable results only when five assumptions roughly hold. Break them badly and your coefficients and predictions can mislead you.
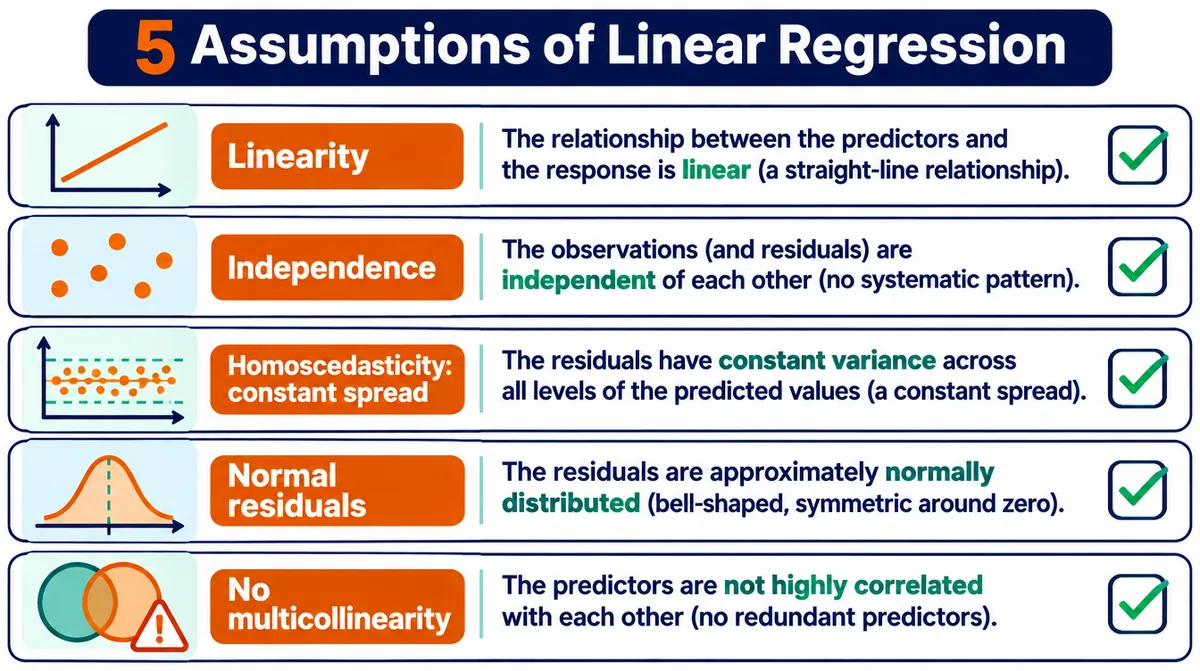
- Linearity: the relationship between inputs and output is roughly a straight line. Check with a scatter plot.
- Independence: each row is independent of the others (watch out for time series).
- Homoscedasticity: residuals have a constant spread. A funnel shape in the residual plot is a red flag.
- Normal residuals: errors are roughly bell-shaped. Check with a histogram or Q-Q plot.
- No multicollinearity: input features shouldn't be strongly correlated with each other. Scikit-learn's guide notes that OLS coefficient estimates rely on the independence of the features. Check with a correlation matrix or VIF.
Pro tip: If the relationship is curved, try polynomial regression (add squared features). If features are highly correlated, try Ridge or Lasso regression. Plain OLS doesn't need feature scaling, but Ridge, Lasso and gradient descent do.
Linear Regression in Machine Learning: Python Code We Tested
Linear regression in Python takes about 10 lines with scikit-learn, and this is the same code we use in class. We ran the code below with scikit-learn 1.9.1 on the built-in diabetes dataset, which has 442 patients and 10 numeric features and needs no download.
from sklearn.datasets import load_diabetes
from sklearn.model_selection import train_test_split
from sklearn.linear_model import LinearRegression
from sklearn.metrics import r2_score, mean_absolute_error

X, y = load_diabetes(return_X_y=True)
X_train, X_test, y_train, y_test = train_test_split(
    X, y, test_size=0.2, random_state=42
)

model = LinearRegression()
model.fit(X_train, y_train)
pred = model.predict(X_test)

print("R2:", round(r2_score(y_test, pred), 3))    # 0.453
print("MAE:", round(mean_absolute_error(y_test, pred), 1))  # 42.8
print(model.intercept_, model.coef_)
Our output: R² = 0.453 and MAE = 42.8 on the 20% test set.
How to Evaluate a Linear Regression Model
A linear regression model is evaluated with error metrics that compare predicted numbers to actual numbers on test data. The three you must know are R², MAE and RMSE.
| Metric | What it tells you | Good value |
|---|---|---|
| R² (R-squared) | Share of the variation in y the model explains | Closer to 1 is better; 0 means no better than the average |
| MAE | Average absolute error, in the target's units | Lower is better |
| RMSE | Like MAE, but punishes big errors more | Lower is better |
Always measure these after a train-test split, because a model scored on its own training data hides overfitting.
So what does our R² of 0.45 mean? The model explains about 45% of the variation in disease progression. That sounds low, but medical data is noisy, and an honest 0.45 on unseen data beats a fake 0.99 on training data.
Linear Regression vs Decision Trees: Our Benchmark
The Fireblaze ML Benchmark compares the four algorithms in this series on the same datasets, the same scikit-learn version (1.9.1) and the same 5-fold cross-validation with random_state=42, so the numbers are directly comparable.
For regression on the diabetes dataset:
| Model | 5-fold CV R² |
|---|---|
| Linear regression | 0.478 |
| Decision tree (default settings) | -0.133 |
A negative R² means the default tree did worse than simply predicting the average. It memorised the training data and fell apart on new rows.
Lesson: always start with linear regression as your baseline. If a complex model can't beat it, the complex model isn't worth it. You'll see the same idea in our decision tree in machine learning guide.
6 Linear Regression Mistakes Beginners Make
Beginners usually lose accuracy with linear regression through six avoidable mistakes:
- Using it for yes/no outcomes. For classification, use logistic regression in machine learning instead.
- Testing on training data. Always hold out a test set or use cross-validation.
- Ignoring outliers. One ₹50 crore bungalow can drag the whole line.
- Feeding correlated features. "Area in sq ft" and "area in sq m" together break coefficient meaning.
- Reading correlation as causation. A coefficient shows association, not cause.
- Skipping the residual plot. It's the fastest way to spot a broken assumption.
Now It's Your Turn
Linear regression is simple on purpose: a straight line, readable coefficients and a score you can trust. Master it and every other algorithm gets easier, which is why we cover it before the support vector machine in machine learning.
Run the code above today, then swap in your own dataset.
Want to build regression projects with trainer feedback? Explore the <a href="/courses/data-science-certification-nagpur/">Data Science certification at Fireblaze</a>, and prepare with these machine learning interview questions.
What will you predict first with linear regression in machine learning?
About the Author
Aniruddha Abhay Kalbande is the founder of Fireblaze AI School, which he started in Nagpur on 31 October 2017. He is an Electronics and Telecommunication Engineer from Yeshwantrao Chavan College of Engineering (YCCE), Nagpur, with 10 years of experience in IT consulting and training. He has trained more than 20,000 students. The school is a NASSCOM partner for its Post Graduate Program in Data Science & Analytics and runs classroom batches at 3 Nagpur centers alongside live online batches across Maharashtra. He writes here on career roadmaps, interview preparation and how to evaluate a training institute honestly.
Sources
- LinearRegression, scikit-learn documentation, 2026
- load_diabetes, scikit-learn documentation, 2026
- Fireblaze ML Benchmark: scikit-learn 1.9.1, 5-fold cross-validation, random_state=42, run November 12, 2026 (code in this article)
FAQ
Frequently Asked Questions
What is linear regression in machine learning with an example?
Linear regression predicts a number by fitting a straight line through data. For example, a model might learn Price = 8 + 0.045 × Area, so a 900 sq ft flat is predicted at 48.5 lakh. It's a supervised learning algorithm used for regression tasks.
What is the difference between simple and multiple linear regression?
Simple linear regression uses one input feature, while multiple linear regression uses two or more. In our test on the diabetes dataset, one feature gave an R² of 0.233 and all 10 features gave 0.453 on the same test split.
Is linear regression supervised or unsupervised?
Linear regression is supervised learning. It trains on labelled data where the correct output value is known for every example, then predicts that value for new data.
What is a good R² score for linear regression?
There's no universal cut-off. An R² of 0.9 is common for clean physical data, while 0.3 to 0.5 can be respectable for noisy human or medical data. Always compare against a baseline and measure on test data, not training data.
When should you not use linear regression?
Avoid linear regression when the output is a category, when the relationship is strongly non-linear, or when outliers dominate the data. Use logistic regression for classification and tree-based models or polynomial features for curved relationships.
Keep Reading
Related Articles
Learning Guides
Logistic Regression in Machine Learning: Explained with Python (2026)
Learn logistic regression in machine learning: the sigmoid, thresholds, confusion matrix, tested Python code with 97.4% accuracy, and why ba
Learning Guides
Decision Tree in Machine Learning: A Visual Guide with Python (2026)
Learn how a decision tree in machine learning works: nodes, Gini impurity, overfitting, pruning, tested Python code and when to switch to a
Learning Guides
Support Vector Machine in Machine Learning: SVM Explained Simply (2026)
Learn the support vector machine in machine learning: margins, support vectors, kernels, the C parameter and tested Python code that hit 97.