 Fireblaze
Learning Guides
Logistic Regression in Machine Learning: Explained with Python (2026)
Learn logistic regression in machine learning: the sigmoid, thresholds, confusion matrix, tested Python code with 97.4% accuracy, and why banks use it.

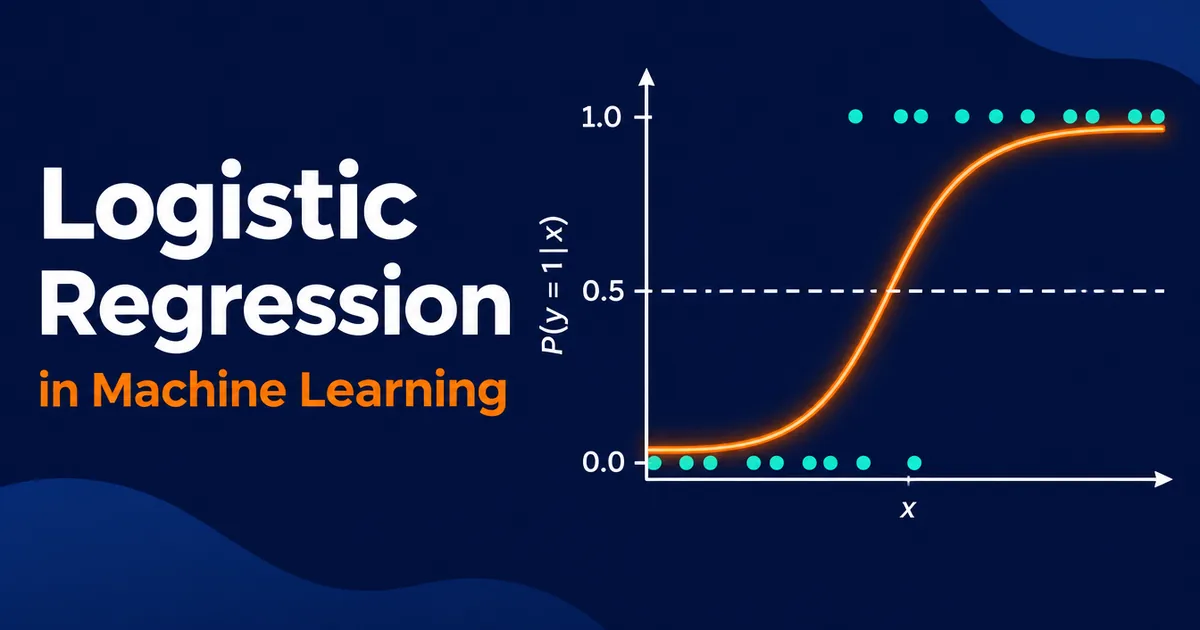
Here's a confusing fact for every beginner: logistic regression isn't used for regression.
It's used for classification.
Spam or not spam. Default or repay. Malignant or benign.
In this guide you'll learn logistic regression in machine learning from the ground up, with the sigmoid explained simply, Python code we actually ran, and the real accuracy it scored.
You'll also see:
- The one-line fix that took our model from 94.9% to 97.4% accuracy
- How to read a confusion matrix without memorising it
- Why banks still trust logistic regression over fancier models
Let's dive in.
Logistic regression in machine learning is a supervised classification algorithm that predicts the probability that an input belongs to a class, such as "will default" or "won't default". It passes a weighted sum of the inputs through a sigmoid function, which squeezes any number into a probability between 0 and 1.
Quick answer: logistic regression in machine learning (November 2026)
- Logistic regression predicts a probability between 0 and 1 using the sigmoid function, p = 1 / (1 + e^-z).
- A threshold, 0.5 by default, turns that probability into a class such as yes or no.
- Scikit-learn's LogisticRegression uses the lbfgs solver, L2 regularization and C = 1.0 by default.
- In our 5-fold test on the breast cancer dataset (569 samples), logistic regression scored 94.9% accuracy without scaling and 97.4% with StandardScaler.
- Banks still favour logistic regression for credit scoring because regulators can read and audit its coefficients.
Contents
- What Is Logistic Regression in Machine Learning?
- Logistic Regression vs Linear Regression
- How the Sigmoid Function Works
- Types of Logistic Regression
- Logistic Regression in Machine Learning: Python Code We Tested
- How to Read a Confusion Matrix
- Our Benchmark: The Scaling Effect
- Where Logistic Regression Is Used in Real Life
- 5 Logistic Regression Mistakes to Avoid
- FAQ
What Is Logistic Regression in Machine Learning?
Logistic regression is a supervised learning algorithm for classification, most often binary classification with two outcomes. It learns from labelled examples, then outputs the probability of each new example belonging to a class.
You'll also see it searched as "logistic regression machine learning"; it's the same model.
The name comes from the logistic (sigmoid) function it uses, plus the fact that, under the hood, it fits a linear equation just like linear regression in machine learning. The difference is what happens to that equation's output.
If you're new to supervised vs unsupervised learning, start with our guide to the <a href="/blogs/types-of-machine-learning/">types of machine learning</a>.
Logistic Regression vs Linear Regression
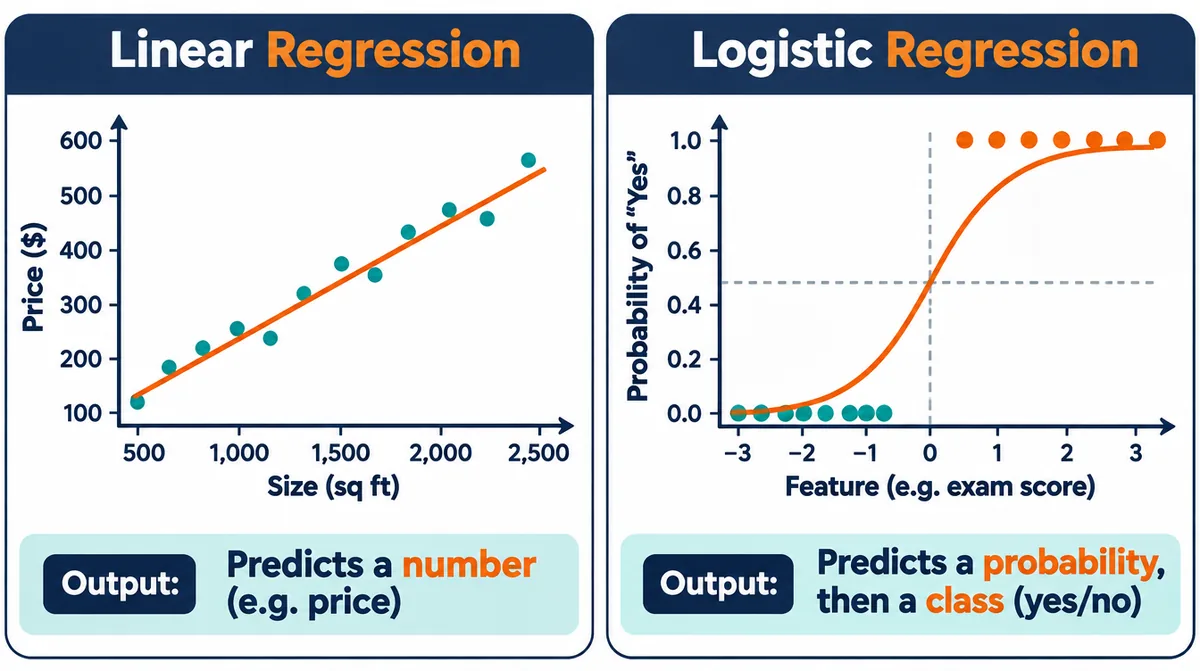
Logistic regression vs linear regression comes down to the output: linear regression predicts a number, while logistic regression predicts a probability that becomes a class.
| Linear regression | Logistic regression | |
|---|---|---|
| Task | Regression | Classification |
| Output | Any number (e.g. ₹48.5 lakh) | Probability 0 to 1, then a class |
| Curve | Straight line | S-shaped sigmoid |
| Loss function | Mean squared error | Log loss (cross-entropy) |
| Example | Predict flat price | Predict loan default |
Why not just use linear regression for yes/no? Because a straight line happily predicts values like 1.7 or minus 0.4, which make no sense as probabilities.
How the Sigmoid Function Works
The sigmoid function converts any number into a value between 0 and 1, which is why logistic regression can output probabilities. Its formula is p = 1 / (1 + e^-z), where z is the weighted sum of the inputs.
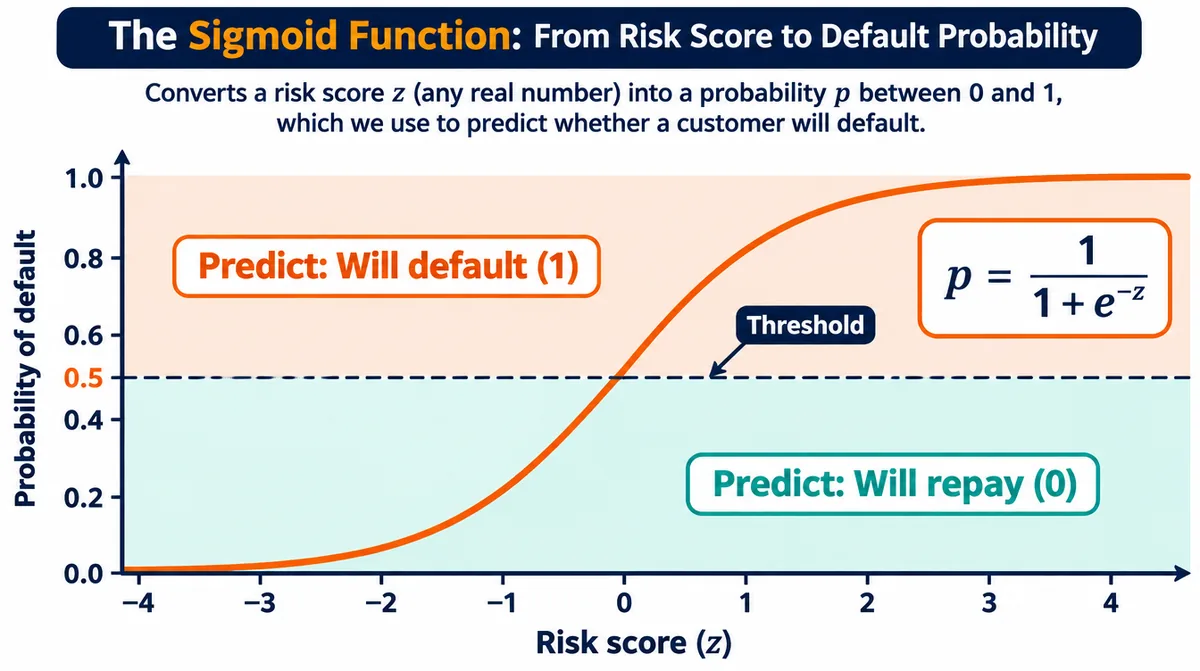
Here's the full flow for a loan model:
- Compute z: z = b0 + b1 × (income) + b2 × (existing EMIs) + ...
- Squash with sigmoid: if z = 2, then p = 1 / (1 + e^-2) ≈ 0.88
- Apply a threshold: 0.88 is above 0.5, so predict "will default"
The threshold doesn't have to be 0.5. A bank worried about bad loans might flag anyone above 0.3.
Pro tip: In interviews, mention log-odds. Logistic regression is linear in the log-odds, so each coefficient converts into an odds ratio: how much the odds change per unit of a feature.
The coefficients are learned by maximum likelihood, which picks the values that make the observed labels most probable.
Types of Logistic Regression
Logistic regression comes in three types, depending on how many classes the output has and whether they're ordered:
| Type | Classes | Example |
|---|---|---|
| Binary | 2 | Spam or not spam |
| Multinomial | 3 or more, no order | Ticket category: billing, technical, delivery |
| Ordinal | 3 or more, ordered | Rating: poor, average, good |
Scikit-learn handles binary and multinomial cases in the same LogisticRegression class.
Logistic Regression in Machine Learning: Python Code We Tested
Logistic regression in Python takes about 12 lines with scikit-learn. We ran this with scikit-learn 1.9.1 on the built-in breast cancer dataset, which has 569 samples, 30 features and two classes: malignant and benign.
from sklearn.datasets import load_breast_cancer
from sklearn.model_selection import train_test_split
from sklearn.pipeline import make_pipeline
from sklearn.preprocessing import StandardScaler
from sklearn.linear_model import LogisticRegression
from sklearn.metrics import accuracy_score, confusion_matrix

X, y = load_breast_cancer(return_X_y=True)
X_train, X_test, y_train, y_test = train_test_split(
    X, y, test_size=0.2, random_state=42, stratify=y
)

model = make_pipeline(StandardScaler(), LogisticRegression())
model.fit(X_train, y_train)
pred = model.predict(X_test)

print(accuracy_score(y_test, pred))    # 0.982
print(confusion_matrix(y_test, pred))  # [[41 1] [1 71]]
Our output: 98.2% accuracy on 114 test samples, with just 2 mistakes.
Scikit-learn's docs list lbfgs as the default solver with max_iter = 100. The C parameter defaults to 1.0, and a smaller C means stronger regularization (so remember feature scaling before tuning it).
Note: In scikit-learn 1.8, the
penaltyparameter was deprecated in favour ofl1_ratioand is due for removal in 1.10. Older tutorials that passpenalty='l1'will start breaking, so learnl1_rationow.
How to Read a Confusion Matrix
A confusion matrix is a 2 × 2 table that shows how many predictions were right and wrong for each class. It's the standard way to evaluate logistic regression, because accuracy alone can hide serious mistakes.
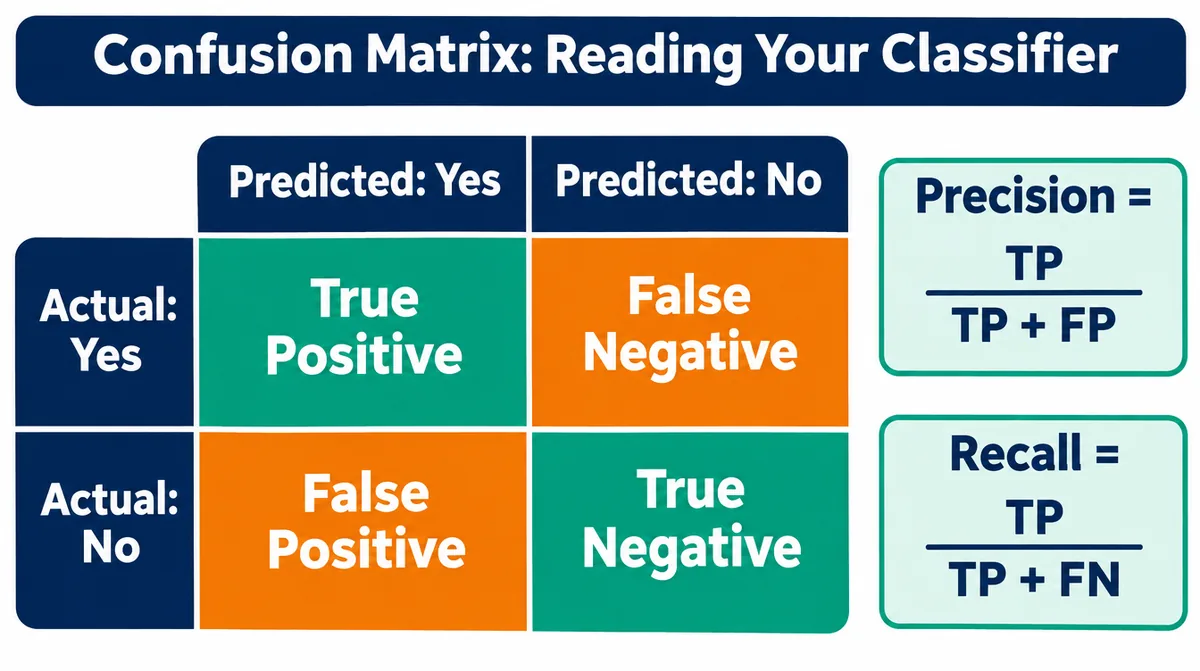
Our test result was [[41, 1], [1, 71]]:
- 41 malignant tumours correctly flagged
- 1 malignant tumour wrongly called benign (the dangerous mistake)
- 1 benign tumour wrongly called malignant
- 71 benign tumours correctly identified
From this, our model had precision = 0.986 and recall = 0.986 for the benign class. The F1 score, which balances the two, is also 0.986. For threshold-free comparison, teams also report ROC AUC.
Which metric matters? In cancer screening or fraud detection, recall on the risky class matters most, because missing a real case costs far more than a false alarm.
Our Benchmark: The Scaling Effect
The Fireblaze ML Benchmark tests all four algorithms in this series on the same breast cancer data, with scikit-learn 1.9.1 and 5-fold stratified cross-validation (random_state=42).
For logistic regression, one line of code changed the result:
| Setup | 5-fold accuracy | Warning? |
|---|---|---|
| LogisticRegression, raw features | 94.9% | Yes: solver failed to converge |
| StandardScaler + LogisticRegression | 97.4% | No |
The raw features range from tiny fractions to values in the thousands. The lbfgs solver hit its 100-iteration limit before settling. Scaling the features fixed both the accuracy and the warning.
For comparison on the same data: an SVM with scaling scored 97.7% and a default decision tree 91.0%. Full results are in our support vector machine in machine learning guide.
Where Logistic Regression Is Used in Real Life
Logistic regression is used wherever a business needs a yes/no prediction that people can explain. Common uses include:
- Credit scoring: predicting loan default for scorecards.
- Churn prediction: will this telecom or OTT customer cancel?
- Medical screening: is this test result high-risk?
- Marketing: will this lead convert?
Credit scoring is the standout. A 2025 study notes that logistic regression and other linear models remain dominant in probability-of-default modelling because their interpretability is sometimes mandatory in regulated environments. Another study found that non-linear models are often considered to lack interpretability by financial regulators.
5 Logistic Regression Mistakes to Avoid
Beginners usually make these five mistakes with logistic regression:
- Forgetting to scale features. Our benchmark shows a 2.5-point accuracy drop and a convergence warning.
- Trusting accuracy on imbalanced data. If 95% of loans are repaid, a model that always says "repay" scores 95% and is useless. Check recall.
- Never tuning the threshold. 0.5 is a default, not a law.
- Ignoring the convergence warning. Scale the data or raise
max_iter. - Expecting it to learn curves. It draws a straight decision boundary unless you add interaction or polynomial features. For curved patterns, try a decision tree in machine learning.
Now It's Your Turn
Logistic regression is the workhorse of classification: fast, explainable and surprisingly accurate once the features are scaled.
Run the code above, then try changing the threshold and watch precision and recall move.
Want hands-on projects with trainer feedback? Explore the <a href="/courses/data-science-certification-nagpur/">Data Science certification at Fireblaze</a>, then prepare with our machine learning interview questions.
Which yes/no problem will you solve first with logistic regression in machine learning?
About the Author
Aniruddha Abhay Kalbande is the founder of Fireblaze AI School, which he started in Nagpur on 31 October 2017. He is an Electronics and Telecommunication Engineer from Yeshwantrao Chavan College of Engineering (YCCE), Nagpur, with 10 years of experience in IT consulting and training. He has trained more than 20,000 students. The school is a NASSCOM partner for its Post Graduate Program in Data Science & Analytics and runs classroom batches at 3 Nagpur centers alongside live online batches across Maharashtra. He writes here on career roadmaps, interview preparation and how to evaluate a training institute honestly.
Sources
- LogisticRegression, scikit-learn documentation, 2026
- LogisticRegression (version 1.8, penalty deprecation), scikit-learn documentation, 2025
- load_breast_cancer, scikit-learn documentation, 2025
- Enhancing ML Interpretability for Credit Scoring, Schwartz, Wang and Fang, arXiv, 2025
- Interpretable Selective Learning in Credit Risk, arXiv, 2022
- Fireblaze ML Benchmark: scikit-learn 1.9.1, 5-fold stratified cross-validation, random_state=42, run November 12, 2026
FAQ
Frequently Asked Questions
What is logistic regression in machine learning in simple words?
Logistic regression is a classification algorithm that predicts the probability of a yes/no outcome. It combines the inputs into a score, converts the score into a probability with the sigmoid function, and uses a threshold such as 0.5 to pick a class.
Why is it called logistic regression if it's used for classification?
The name comes from the logistic (sigmoid) function and from the linear regression equation it uses internally. The model regresses the log-odds of the outcome on the inputs, then converts that into a probability and a class.
What is the difference between logistic regression and linear regression?
Linear regression predicts a continuous number using a straight line and mean squared error. Logistic regression predicts a probability between 0 and 1 using a sigmoid curve and log loss, then turns it into a class.
Do I need to scale features for logistic regression?
Scaling isn't mathematically required, but it usually helps. In our test on the breast cancer dataset, adding StandardScaler raised 5-fold accuracy from 94.9% to 97.4% and removed a convergence warning.
Can logistic regression handle more than two classes?
Yes. Multinomial logistic regression handles three or more unordered classes, and scikit-learn's LogisticRegression supports it in the same class. Ordinal logistic regression handles ordered classes such as poor, average and good.
Keep Reading
Related Articles
Learning Guides
Linear Regression in Machine Learning: A Beginner's Guide with Python (2026)
Learn linear regression in machine learning with a simple example, the math in plain English, tested Python code, real R² scores and 6 commo
Learning Guides
Decision Tree in Machine Learning: A Visual Guide with Python (2026)
Learn how a decision tree in machine learning works: nodes, Gini impurity, overfitting, pruning, tested Python code and when to switch to a
Learning Guides
Support Vector Machine in Machine Learning: SVM Explained Simply (2026)
Learn the support vector machine in machine learning: margins, support vectors, kernels, the C parameter and tested Python code that hit 97.