 Fireblaze
 Learning Guides
Measures of Central Tendency: Mean, Median, and Mode Explained
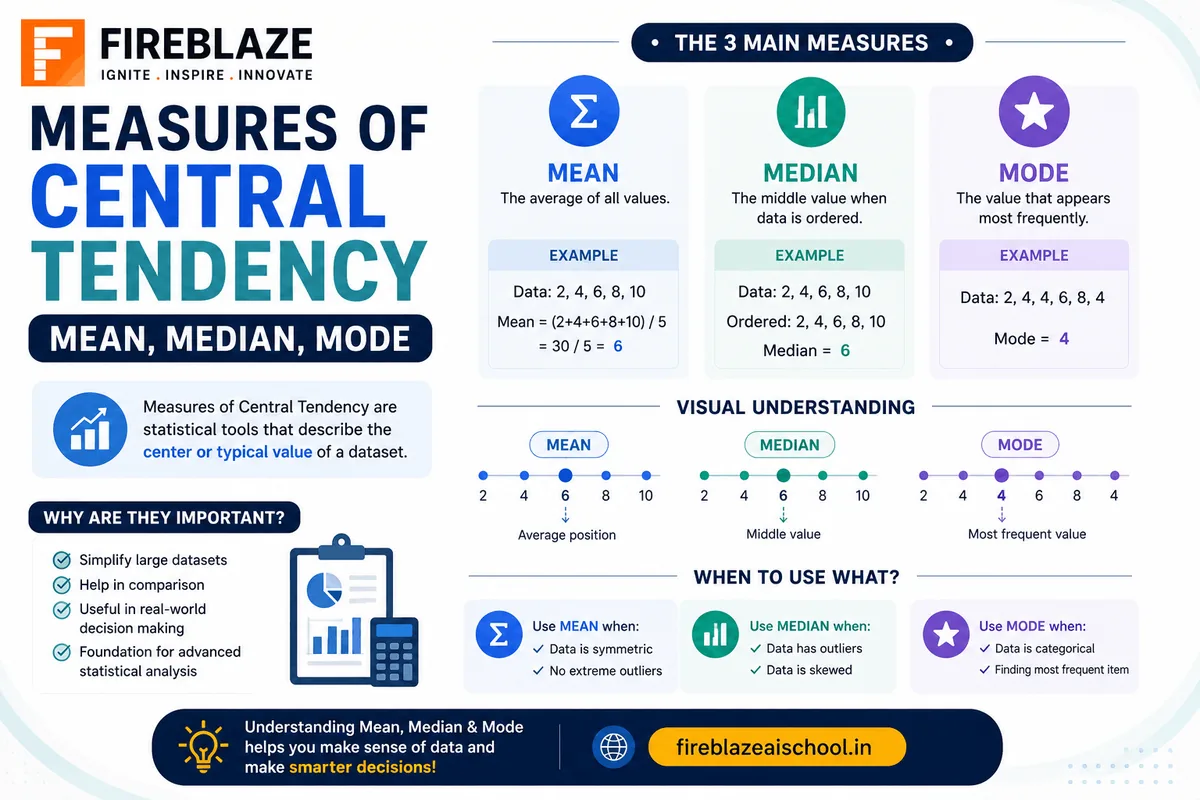
Statistics forms the foundation of Data Science, Data Analytics, Machine Learning, and Business Intelligence. One of the most important statistical concepts is Measures of Central Tendency.
Measures of Central Tendency help us identify the central or typical value within a dataset. Instead of analyzing every individual observation, these measures provide a single value that represents the entire dataset.
The three primary measures of central tendency are:
Mean
Median
Mode
Understanding these concepts is essential for anyone pursuing a career in Data Science, Data Analytics, Artificial Intelligence, or Business Analytics.
What Are Measures of Central Tendency?
Measures of Central Tendency are statistical measures used to determine the center point or typical value of a dataset.
They help answer questions such as:
What is the average salary of employees?
What is the typical age of customers?
What score represents the performance of a class?
The goal is to summarize large datasets using a single representative value.
Types of Measures of Central Tendency
There are three main types:
Mean
Median
Mode
Each measure has its own applications, advantages, and limitations.
Mean (Average)
The Mean is the most commonly used measure of central tendency.
It is calculated by adding all values in a dataset and dividing the sum by the number of observations.
Formula
Mean = Sum of Observations / Number of Observations
Example of Mean
Consider the following dataset:
10, 20, 30, 40, 50
Step 1:
Find the sum.
10 + 20 + 30 + 40 + 50 = 150
Step 2:
Count the observations.
5
Step 3:
Calculate the mean.
Mean = 150 / 5 = 30
Answer
The Mean is 30.
Advantages of Mean
Easy to calculate
Uses all observations
Widely used in statistical analysis
Useful for mathematical computations
Limitations of Mean
Mean is sensitive to outliers.
Example:
10, 15, 20, 25, 200
The value 200 significantly affects the average and may not represent the dataset accurately.
Median
The Median is the middle value in a sorted dataset.
Unlike the mean, it is not affected by extreme values.
Steps to Find the Median
For Odd Number of Observations
Arrange the data in ascending order and select the middle value.
Example:
5, 10, 15, 20, 25
Median = 15
For Even Number of Observations
Take the average of the two middle values.
Example:
10, 20, 30, 40
Median:
(20 + 30) / 2 = 25
Median = 25
Advantages of Median
Not affected by outliers
Suitable for skewed data
Represents the middle position accurately
Limitations of Median
Does not use all observations
Less useful for advanced mathematical calculations
Mode
The Mode is the value that occurs most frequently in a dataset.
It is particularly useful for categorical data.
Example of Mode
Dataset:
2, 4, 4, 5, 7, 7, 7, 9
Frequency:
2 appears once
4 appears twice
5 appears once
7 appears three times
9 appears once
Mode = 7
Types of Mode
Unimodal
One mode exists.
Example:
1, 2, 2, 3, 4
Mode = 2
Bimodal
Two modes exist.
Example:
1, 2, 2, 3, 3, 4
Modes = 2 and 3
Multimodal
More than two modes exist.
Example:
1, 1, 2, 2, 3, 3
Modes = 1, 2, and 3
Advantages of Mode
Simple to understand
Useful for categorical data
Not affected by outliers
Limitations of Mode
May not exist in some datasets
Can have multiple values
Less useful for mathematical analysis
Difference Between Mean, Median, and Mode
| Measure | Definition | Best Used When |
|---|---|---|
| Mean | Average of all values | Data has no extreme outliers |
| Median | Middle value | Data contains outliers |
| Mode | Most frequent value | Categorical or frequency analysis |
Real-World Applications
Measures of Central Tendency are used across multiple industries.
Finance
Average income analysis
Investment performance evaluation
Risk assessment
Healthcare
Patient age analysis
Disease occurrence studies
Medical research
Education
Student performance analysis
Exam result evaluation
Academic research
E-Commerce
Customer purchase analysis
Product demand forecasting
Pricing strategies
Banking
Loan approval analysis
Credit score assessment
Customer segmentation
Importance in Data Science and Analytics
Measures of Central Tendency are among the first concepts used during Exploratory Data Analysis (EDA).
Data Scientists and Analysts use them to:
Understand datasets quickly
Detect unusual values
Identify trends
Prepare data for machine learning models
Before building predictive models, analysts often calculate mean, median, and mode to gain insights into data distribution.
Interview Questions on Measures of Central Tendency
What is Central Tendency?
Central Tendency refers to statistical measures that identify the center or typical value of a dataset.
What are the Three Measures of Central Tendency?
Mean
Median
Mode
Which Measure is Least Affected by Outliers?
Median is least affected by outliers.
When Should Mode Be Used?
Mode is useful when identifying the most frequently occurring value, especially in categorical data.
Which Measure Uses All Observations?
Mean uses every value in the dataset.
Why Every Data Scientist Must Understand Mean, Median, and Mode
Whether you're working in Data Science, Machine Learning, Business Analytics, or Artificial Intelligence, understanding Measures of Central Tendency is essential.
These concepts form the basis of:
Exploratory Data Analysis
Statistical Modeling
Data Visualization
Predictive Analytics
Machine Learning
Strong statistical fundamentals help professionals make better data-driven decisions and improve analytical accuracy.
Final Thoughts
Measures of Central Tendency are fundamental statistical tools used to summarize and understand data. Mean, Median, and Mode each provide unique insights into a dataset and are widely used in Data Science, Data Analytics, Business Intelligence, and Machine Learning.
Mastering these concepts helps learners build a strong foundation in statistics and prepares them for more advanced analytical techniques. Whether you're a beginner or an aspiring Data Scientist, understanding Mean, Median, and Mode is a crucial step toward becoming a data professional.
Suggested Internal Links
Statistics for Data Science
Data Science Interview Questions
Probability and Statistics Basics
Data Analytics Course
Machine Learning Fundamentals
Focus Keyword
Measures of Central Tendency
Secondary Keywords
Mean Median Mode
Measures of Central Tendency in Statistics
Statistics for Data Science
Mean Median Mode Examples
Central Tendency in Data Analytics
Statistics Concepts for Beginners
Keep Reading
Related Articles
Learning Guides
Introduction to Computer Vision: A Beginner’s Guide
Discover the basics of Computer Vision, a rapidly growing field of Artificial Intelligence that enables machines to understand images and videos. Expl
All About PyCaret: Conversation with Mr. Moez Ali and Mr. Aniruddha Kalbande | EP-06
Explore PyCaret and its impact on machine learning development through an insightful conversation with PyCaret creator Moez Ali and AI expert Aniruddh
What is Data Mining? Complete Guide for Beginners
Learn what Data Mining is, how it works, key techniques, tools, applications, advantages, challenges, and its role in Data Science, Machine Learning,