 Fireblaze
Career Roadmaps
What Is a Data Analyst? Meaning, Role, Skills and Salary in India (2026)
A data science roadmap for 2026 built for India: 5 stages, the data scientist skills and tools to learn, and a month-by-month timeline for every background.


You keep hearing that data analyst is one of the best jobs for freshers.
But when you search "what is data analyst", you get vague answers like "a person who turns data into insights." What does that actually mean on a Monday morning at work?
This guide answers what is a data analyst in plain language, with a real worked example, Indian salary data and the exact skills employers ask for in 2026.
You'll see:
- What a data analyst does all day (with a simple example you can follow)
- The skills, tools and job titles to know in India
- What data analysts earn, and how to become one without an engineering degree
Let's start.
A data analyst is a professional who collects, cleans and studies data to answer business questions, then shares the answers as reports, charts or dashboards so managers can make better decisions. In India, data analysts typically use Excel, SQL and Power BI, and the average salary is about ₹6.28 lakh per year (Indeed, October 2026).
Quick answer: what is a data analyst (November 2026)
- A data analyst turns raw business data into clear answers, using tools like Excel, SQL, Power BI and Python.
- Data analysts follow six steps (Ask, Prepare, Process, Analyze, Share, Act), the process taught in the Google Data Analytics Certificate.
- The average data analyst salary in India is about ₹6.28 lakh per year (Indeed, October 2026), and entry-level pay averages about ₹4.13 lakh (PayScale, July 2026).
- Any graduate, including BCom, BBA, BSc and BCA, can become a data analyst with strong Excel, SQL and dashboard skills.
- Many Indian analyst jobs are listed as MIS Executive, Business Analyst or BI Analyst instead of "data analyst".
- About 38.6% of data and analytics job postings in India mention AI skills (Indeed data, September 2025).
What Is a Data Analyst? The Simple Meaning (With an Example)
A data analyst is the person a business asks, "What is really going on, and what should we do about it?" The analyst finds the data, checks it, studies it and comes back with a clear answer and a recommendation.
Definitions only go so far. So let's watch one analysis happen.
A Worked Example: The Cafe With Falling Sales
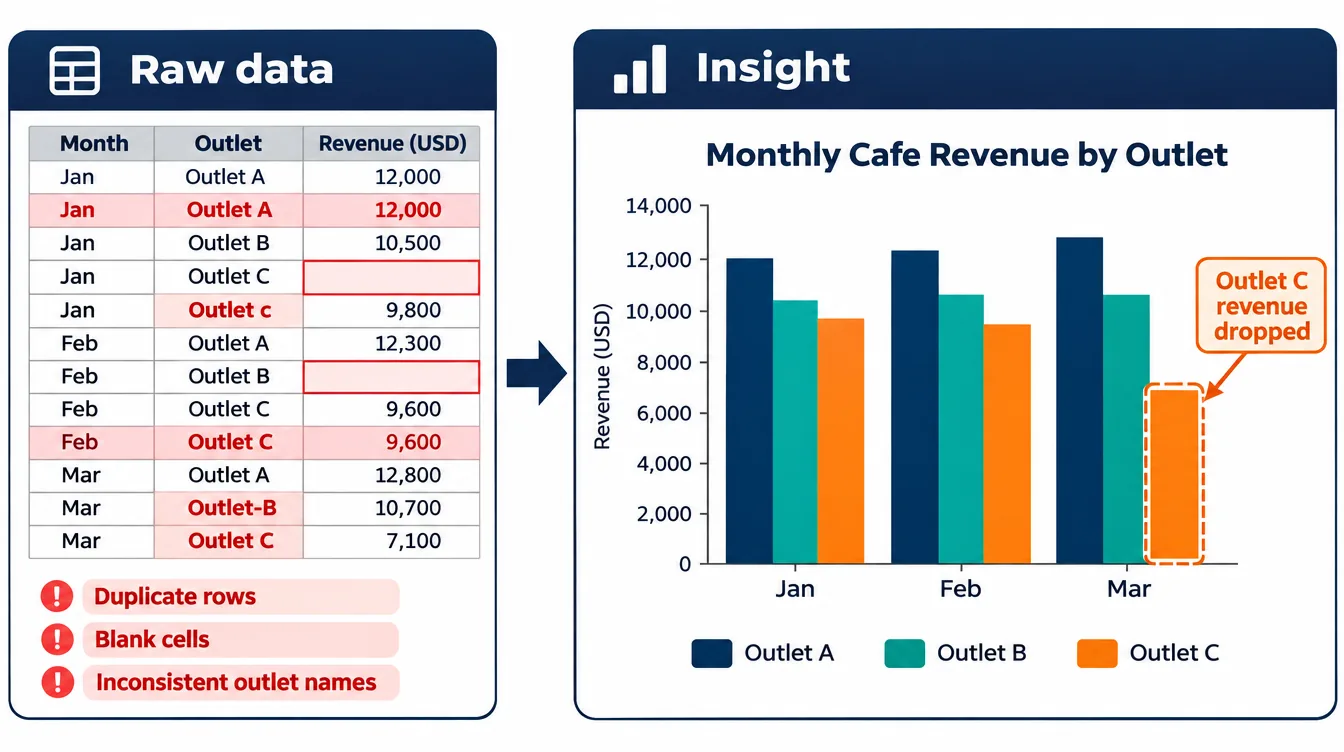
Imagine a small cafe chain with 3 outlets in Nagpur. Monthly revenue dropped from ₹9.0 lakh to ₹7.8 lakh in three months, a 13% fall.
The owner asks you, the data analyst, to find out why.
(This is an illustrative example to show the method. The numbers are made up for teaching.)
Here's what you'd do:
- Pull the data. Export 6 months of billing data from the POS system: date, outlet, item, quantity, price, payment mode.
- Clean it. Remove 140 test bills, fix outlet names typed three different ways ("Dharampeth", "dharampeth ", "Dharampeth Br.") and fill missing dates.
- Slice it. Build a pivot table of revenue by outlet and month.
- Find the pattern. Two outlets are flat. One outlet's revenue fell 35%, and almost all of the drop is in evening sales after 7 pm.
- Dig deeper. Evening bills at that outlet fell right after a road-widening project started outside, which blocked parking.
- Recommend. Push evening delivery on Swiggy and Zomato for that outlet and run a "pickup from the back lane" offer until the work ends.
That's it. That's the job.
Notice what the analyst did not do: build a complex AI model.
Most of the value came from clean data, a pivot table, the right question and a clear recommendation.
Key takeaway: A data analyst is paid for answers, not for charts. The chart is just how the answer gets delivered.
Data Analyst Meaning in Hindi and Marathi
Data analyst meaning in Hindi: डेटा विश्लेषक (data vishleshak), a person who studies data to find useful information for decisions. In Marathi, a data analyst is also called डेटा विश्लेषक, or simply "डेटा अॅनालिस्ट" in everyday speech.
Here's the idea in simple words:
- Hindi: डेटा एनालिस्ट वह व्यक्ति है जो कंपनी के आंकड़ों (data) को इकट्ठा करता है, साफ करता है और उनका विश्लेषण करके बताता है कि बिज़नेस में क्या हो रहा है और आगे क्या करना चाहिए।
- Marathi: डेटा अॅनालिस्ट म्हणजे अशी व्यक्ती जी कंपनीचा डेटा गोळा करते, तो स्वच्छ करते आणि त्याचं विश्लेषण करून व्यवसायात नेमकं काय चाललंय आणि पुढे काय करायचं, हे सोप्या भाषेत सांगते.
In practice, most Indian companies use the English term "data analyst" even in Hindi or Marathi conversations. Tool names like Excel, SQL and Power BI stay in English too.
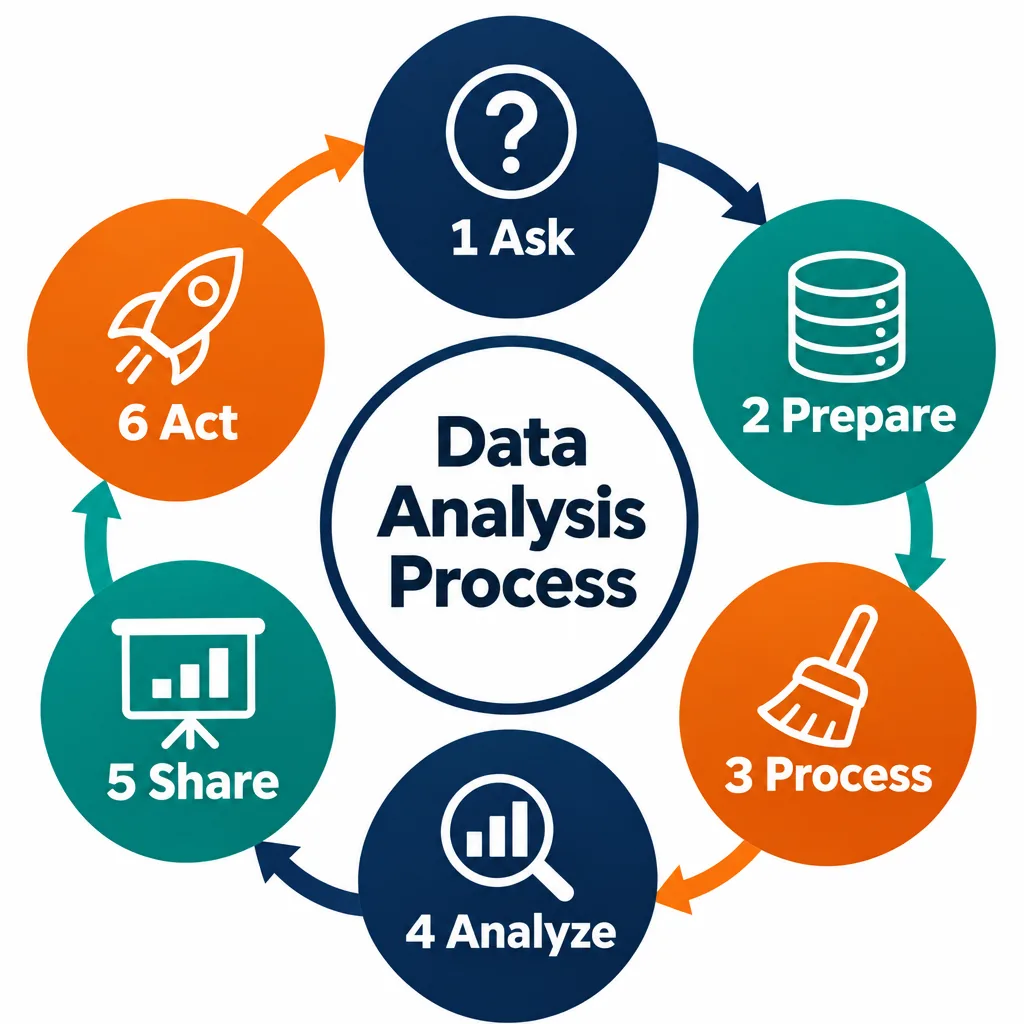
What Does a Data Analyst Do? The 6-Step Process
A data analyst works through six steps: Ask, Prepare, Process, Analyze, Share and Act. Google teaches this exact process in its Data Analytics Professional Certificate, and it matches how most analytics teams work (Grow with Google, April 2025).
| Step | What the data analyst does | Example from the cafe case |
|---|---|---|
| 1. Ask | Defines the business question with the manager | "Why did revenue fall 13%?" |
| 2. Prepare | Finds and collects the right data | POS billing export, 6 months |
| 3. Process | Cleans and organises the data | Removes test bills, fixes outlet names |
| 4. Analyze | Finds patterns using formulas, SQL or Python | Pivot by outlet, month and hour |
| 5. Share | Presents findings in a report or dashboard | One-page summary with 2 charts |
| 6. Act | Helps the business act on the insight | Delivery push for one outlet |
Google notes these steps are iterative. You often loop back. For example, you might find a data problem in step 4 and return to step 3.
The step most beginners underestimate is Process. Cleaning and preparing data takes a big share of an analyst's time, because real business data is full of duplicates, blanks and typing errors.
In job descriptions, these steps show up as data analyst roles and responsibilities like:
- Collecting data from databases, spreadsheets and business software
- Cleaning, validating and organising data sets
- Writing SQL queries to pull and combine data
- Building reports, KPI trackers and dashboards in Power BI or Tableau (data visualization)
- Spotting trends, problems and opportunities
- Presenting findings to managers and suggesting actions
A Typical Workday, Hour by Hour
A data analyst's typical day mixes routine reporting, problem-solving and meetings. Here's what a normal day can look like for an analyst at an Indian e-commerce or retail company:
| Time | Task |
|---|---|
| 9:30 am | Check that overnight data refreshed and the daily sales dashboard is correct |
| 10:00 am | Stand-up meeting: the sales head asks why returns rose in Pune |
| 10:30 am | Write SQL queries to pull return data by city, product and courier |
| 12:30 pm | Clean the data in Excel or Python and spot a pattern: one courier partner has 3x the returns |
| 2:00 pm | Lunch, then update the weekly MIS report for leadership |
| 3:30 pm | Build two charts and a one-page summary on the returns issue |
| 5:00 pm | Present findings to the sales and operations teams |
| 6:00 pm | Document the queries so the analysis can be repeated next month |
The exact mix changes by company.
In a small business, one analyst may handle everything from data cleaning to presenting to the owner. In a large company, analysts usually own one area, like marketing, finance or supply chain.

Pro tip: Notice how much of the day is communication. Strong analysts can explain a finding in two sentences to someone who has never opened Excel.
The 4-Question Ladder: Types of Data Analysis
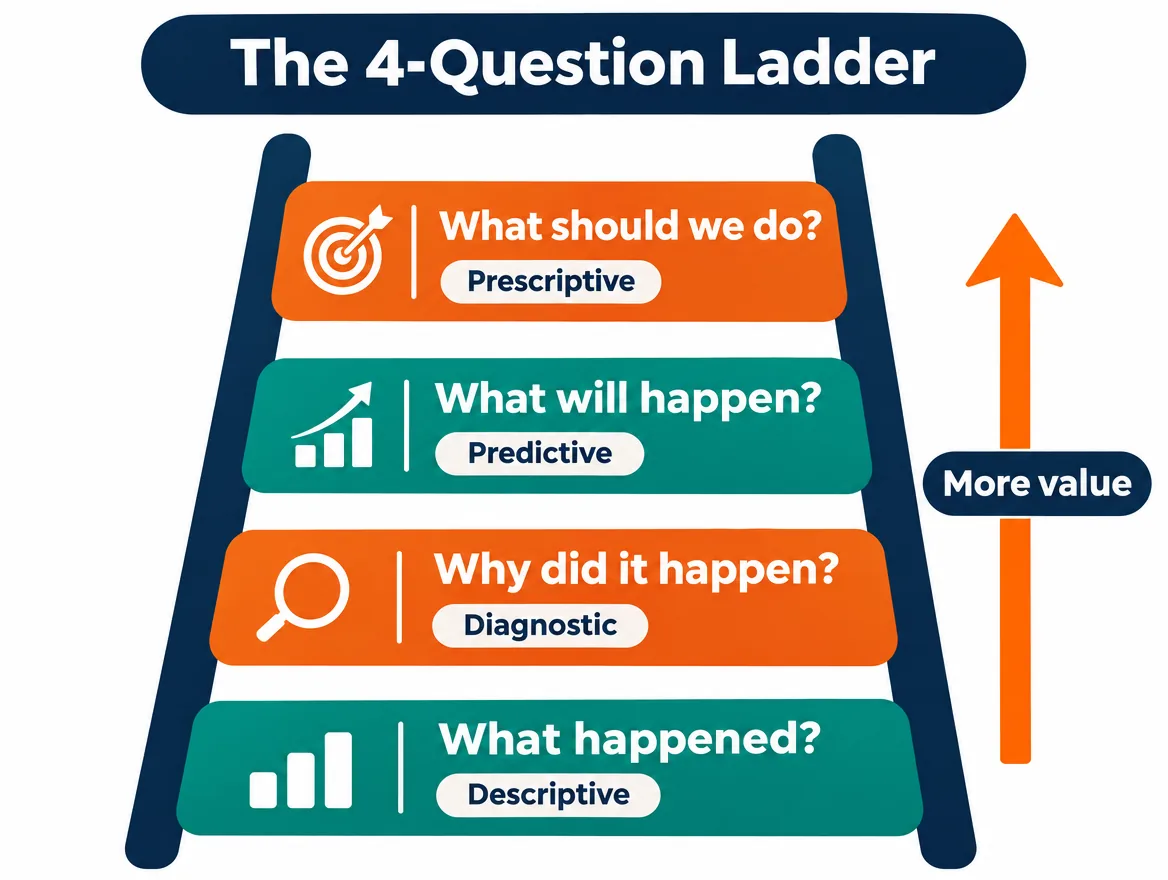
Every piece of data analysis answers one of four questions: what happened, why it happened, what will happen, and what to do about it. We call this the 4-Question Ladder.
Each rung matches one of the four standard types of analytics: descriptive analytics, diagnostic analytics, predictive analytics and prescriptive analytics. Each rung is harder, and more valuable, than the one below.
| Rung | Question | Type of analysis | Indian business example | Who usually does it |
|---|---|---|---|---|
| 1 | What happened? | Descriptive | "Diwali week sales were ₹42 lakh, up 18% on last year." | Data analyst, MIS executive |
| 2 | Why did it happen? | Diagnostic | "Growth came from UPI-paying repeat customers in tier-2 cities." | Data analyst |
| 3 | What will happen? | Predictive | "Based on trends, January demand will dip about 10%." | Senior analyst, data scientist |
| 4 | What should we do? | Prescriptive | "Cut January ad spend in tier-1 cities and shift it to WhatsApp offers for repeat buyers." | Senior analyst, data scientist, manager |
(Example figures are illustrative.)
Here's why the ladder matters for your career:
- Entry-level analysts live on rungs 1 and 2. Reports, dashboards and root-cause analysis.
- Pay rises as you climb. Analysts who can forecast and recommend (rungs 3 and 4) move into senior analyst, analytics manager or data scientist roles.
- Data entry never leaves rung 0. Typing data in is not analysis. More on that difference below.
Data Analyst Skills You Need in 2026
The core data analyst skills in 2026 are Excel, SQL, a BI tool like Power BI, basic statistics, clear communication and, increasingly, AI tools for faster analysis. Python is the main skill that separates higher-paying roles from entry-level ones.
| Skill | Why it matters | Priority for a fresher |
|---|---|---|
| Excel (pivot tables, XLOOKUP, charts) | Nearly every analyst and MIS role uses it daily | Must have |
| SQL | Lets you pull and join data from company databases | Must have |
| Power BI or Tableau | Dashboards and automated reports | Must have |
| Statistics basics | Averages, distributions, correlation, A/B tests | Must have |
| Communication and data storytelling | Turning numbers into decisions | Must have |
| Business understanding | Knowing what sales, margin and churn mean | Must have |
| Python (Pandas) | Bigger data, automation, higher-paying roles | Should have |
| AI tools for analysis | Faster cleaning, summaries and first drafts | Growing fast |
Why is AI on the list? Because employers are already asking. Fireblaze's AI Skill Index of India cites Indeed data showing 38.6% of data and analytics job postings in India mention AI (September 2025).
But AI doesn't replace the core. An AI tool can write a SQL query in seconds.
You still need to know whether the query is right and whether the answer makes business sense.
Resource: New to spreadsheets? Start with our Excel for data analysis guide.
The Core Tool Stack: Excel to Python
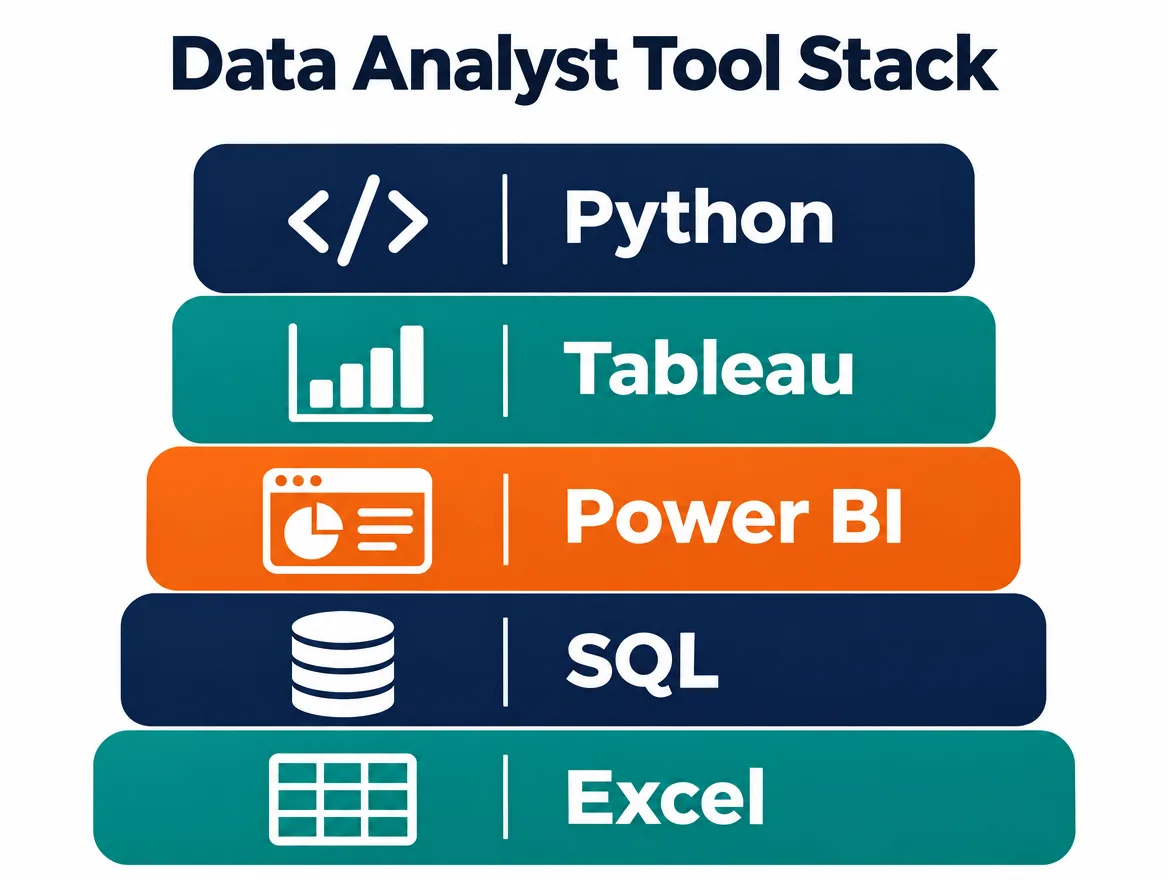
Data analyst tools in India come down to five names. You don't need all of them on day one, but you'll meet all of them within your first year.
- Microsoft Excel. The starting point for cleaning, pivot tables and quick charts. Still the most common tool in Indian MIS and reporting roles.
- SQL. The language for querying databases like MySQL, PostgreSQL and SQL Server. Most analyst interviews include a SQL round. Our SQL course in Nagpur covers the queries that come up most.
- Power BI. Microsoft's business intelligence tool for interactive dashboards. Widely used by Indian companies already on Microsoft 365. See the Power BI course in Nagpur if you want structured practice.
- Tableau. Another popular dashboard tool, common in MNCs and consulting firms.
- Python. With libraries like Pandas and Matplotlib, Python handles large data sets and automates repeat work. A good next step after SQL; the Python course in Nagpur starts from zero.
Plus, analysts increasingly use AI assistants (like ChatGPT, Microsoft Copilot in Excel and Power BI, or Gemini in Google Sheets) to draft formulas, explain errors and summarise findings.
Specialisations and the Job Titles They Hide Under
Data analysts specialise by business area, and in India many analyst jobs carry a different title. If you only search "data analyst", you miss a large share of openings.
Common types of data analysts:
- Business analyst: connects business needs with data and process changes.
- Marketing analyst: studies campaigns, ad spend, leads and customer behaviour.
- Financial analyst: works on budgets, costs, revenue and forecasts.
- Operations or supply chain analyst: tracks inventory, delivery and production efficiency.
- Product analyst: studies how users behave inside an app or website.
- Healthcare analyst: works with hospital, insurance and patient data.
- BI analyst / Power BI developer: builds and maintains company dashboards.
Here's what we found when we checked real listings.
Indeed's results for "data analyst" in Nagpur in October 2026 included titles like MIS Officer, MIS Executive, Business Analyst, SQL Developer, Supply Chain Analyst and Research Analyst. Same core skills, different labels.
Pro tip: Read the duties, not the title. An "MIS Executive" ad that asks for SQL and dashboards is a real analyst job. A "Data Analyst" ad that is 90% typing is not.
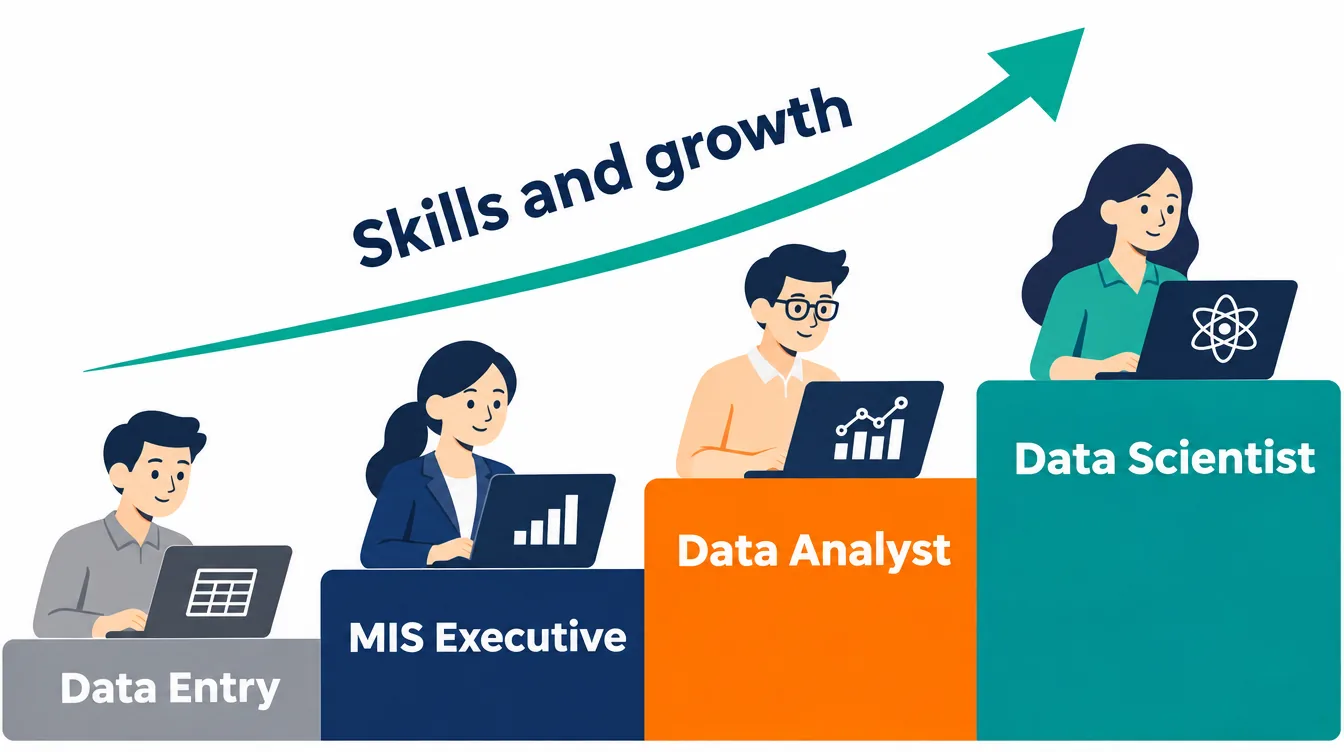
Data Analyst vs Data Scientist vs MIS Executive
A data analyst explains what happened and why using existing data; a data scientist builds models to predict what will happen; an MIS executive mainly produces regular reports. A data entry operator only types data into systems and does not analyse it.
This is the comparison most Indian freshers actually need:
| Data entry operator | MIS executive | Data analyst | Data scientist | Data engineer | |
|---|---|---|---|---|---|
| Main job | Typing and updating records | Daily/monthly reports | Answering business questions with data | Predictive models and ML | Building data pipelines |
| Ladder rung | None | Rung 1 | Rungs 1 to 2 (sometimes 3) | Rungs 3 to 4 | Supports all rungs |
| Key tools | Excel, ERP screens | Excel, basic SQL | Excel, SQL, Power BI, Python | Python, statistics, ML libraries | SQL, Python, cloud, Spark |
| Coding needed | No | Little | Moderate (SQL, some Python) | High | High |
| Typical entry route | Any graduate | Any graduate | Any graduate with skills | STEM, maths-heavy | Engineering, CS |
| Future outlook | Declining (WEF 2025) | Shifting to analyst work | Growing | Growing | Growing |
The World Economic Forum's Future of Jobs Report 2025 lists data entry clerks among the fastest-declining jobs and big data specialists among the fastest-growing. That gap is the strongest reason to move from data entry or MIS into analysis.
Resource: Want the deeper comparison? Read data science vs big data vs data analytics.
Data Analyst Salary in India (2026)
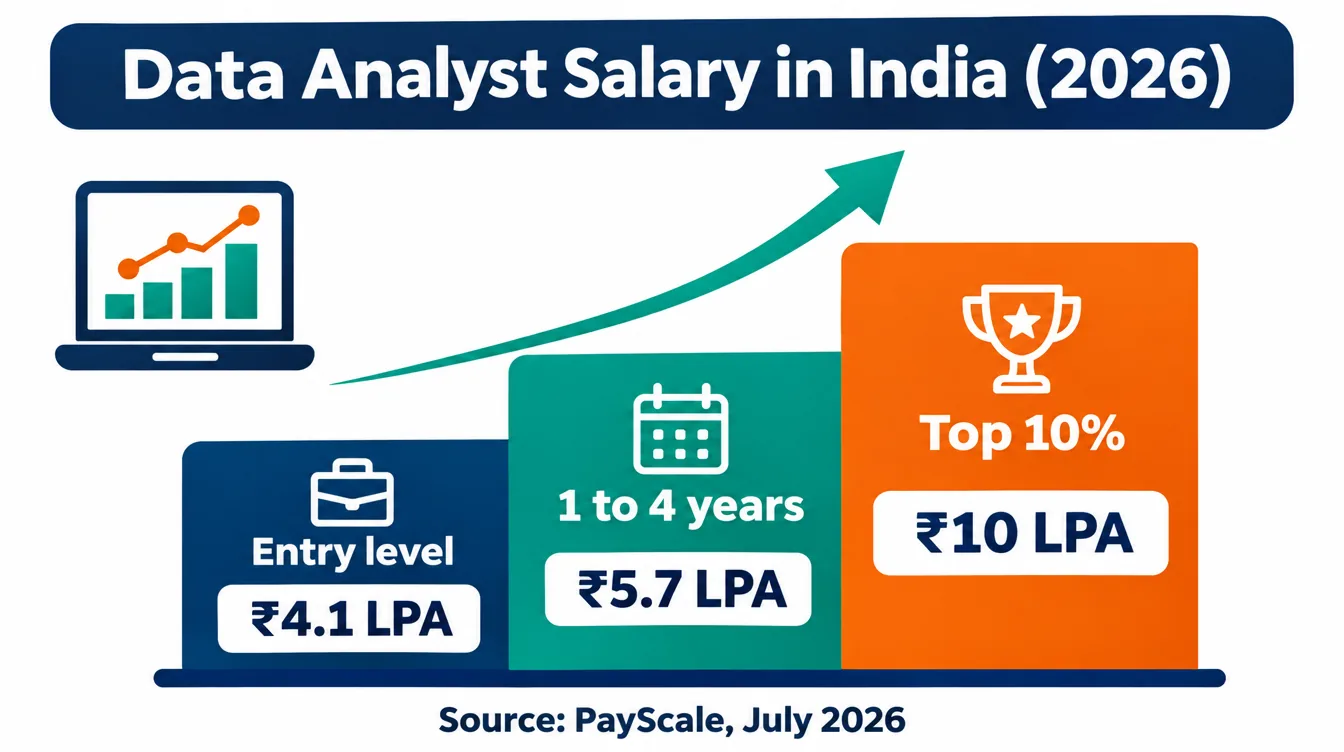
The average data analyst salary in India is about ₹6.28 lakh per year, according to Indeed (October 2026). Freshers usually start lower, around ₹4.13 lakh on average, according to PayScale's July 2026 data.
| Experience | Average total pay (India) | Sample size | Source |
|---|---|---|---|
| Entry level (under 1 year) | ₹4,13,462 | 576 salaries | PayScale, July 2026 |
| Early career (1 to 4 years) | ₹5,65,999 | 1,588 salaries | PayScale, July 2026 |
| All levels, average | ₹6,27,622 | Not stated | Indeed India, October 2026 |
| Top earners (90th percentile) | About ₹10,00,000 | 2,389 profiles | PayScale, July 2026 |
What pushes pay up:
- Skills: SQL plus Power BI plus Python beats Excel alone.
- City: Bengaluru, Hyderabad and NCR usually pay more than tier-2 cities, though living costs are higher too.
- Industry: Product companies, fintech and consulting often pay more than BPOs and small businesses.
- Rung on the ladder: Analysts who forecast and recommend earn more than those who only report.
Note: Salary sites update often and use different samples. Treat these as ranges, not promises.
For a full breakdown by city and role, see data analyst salary in India.
Who Can Get Into Analytics? (Eligibility)
Any graduate can become a data analyst, including BCom, BBA, BA, BSc, BCA, BE and MBA graduates. Employers care more about your Excel, SQL and dashboard skills, plus proof through projects, than about your degree name.
Some backgrounds have a head start:
- Commerce and management (BCom, BBA, MBA): you already understand sales, finance and profit, which is half the job.
- Science and maths (BSc, BSc Stats): statistics comes easier.
- Computer applications (BCA, BSc IT, BE): SQL and Python come easier.
- Working professionals in sales, operations or finance: you know the business problems analysts solve. This is one of the smoothest career switches.
Here's the honest part: you don't need to be a "maths genius". Most day-to-day analysis uses averages, percentages, growth rates and comparisons. You need to be careful, curious and comfortable with numbers.
How to Become a Data Analyst in 5 Steps
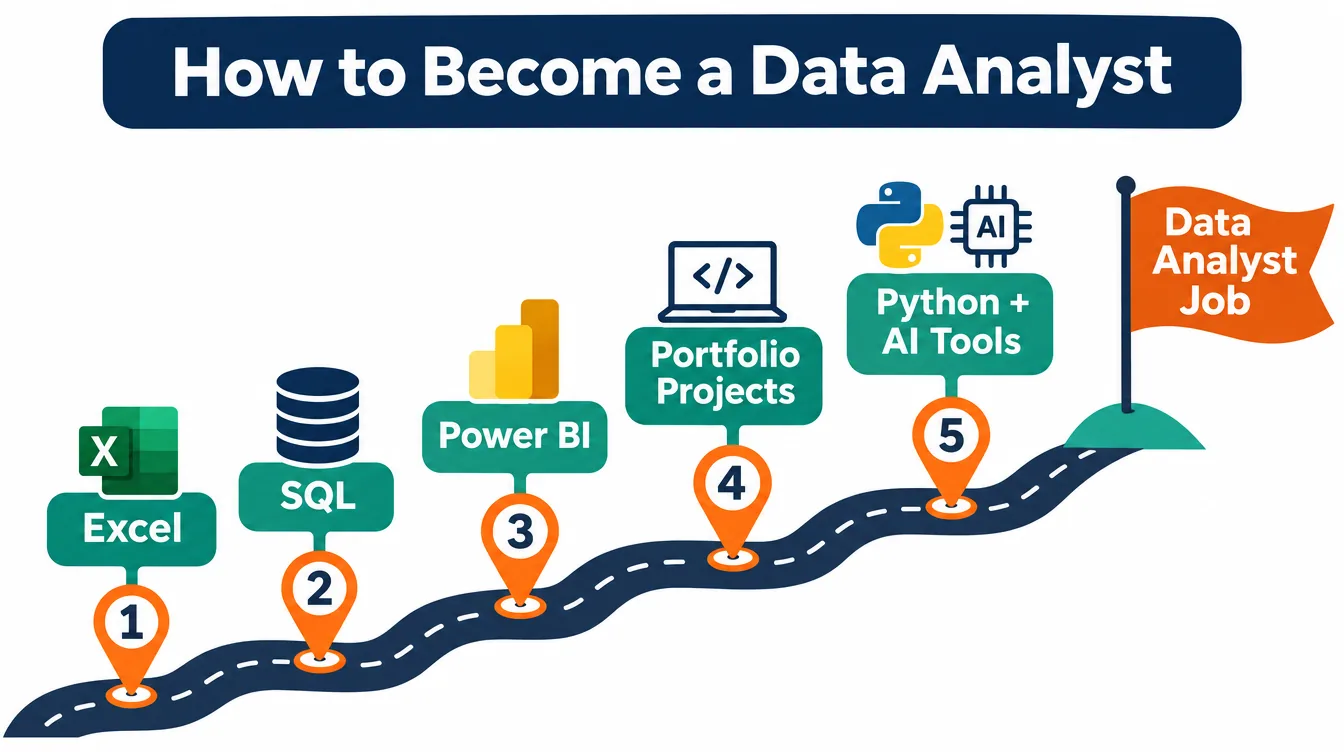
Becoming a data analyst usually takes 4 to 6 months of focused learning for a beginner studying 2 to 3 hours a day. Here's the path:
- Learn Excel properly (3 to 4 weeks). Formulas, XLOOKUP, pivot tables, charts and basic cleaning.
- Learn SQL (4 weeks). SELECT, WHERE, GROUP BY, JOINs, then window functions. Practise on sales or HR data sets.
- Learn Power BI or Tableau (4 weeks). Data import, Power Query cleaning, relationships and basic DAX.
- Build 3 portfolio projects (4 to 6 weeks). A sales dashboard, an HR attrition analysis and one project from an industry you like. Use the 6-step process and write up each one. Need ideas? See our data analytics project ideas.
- Add Python and AI tools, then apply (ongoing). Learn Pandas basics, use AI assistants responsibly, and start applying to the job titles listed above. Prepare with real data analytics interview questions.
Pro tip: Start applying in month 3 or 4, not after you "finish learning". Interviews teach you what to learn next.
Do You Need a Course?
No. You can self-learn with free resources if you're disciplined. A course helps most when you want deadlines, mentor feedback on projects and interview practice.
If you're in or near Nagpur, Fireblaze's data analyst course in Nagpur is a 5-month Professional Certification in AI-Powered Data Analytics. It covers Excel, SQL, Power BI, Python and AI-assisted analytics with a capstone project, in classroom batches at three Nagpur centres or live online.
The fee is ₹75,000 including GST. The program includes placement assistance, not a placement guarantee; the placements page explains what's included.
Is Analytics a Good Career Choice in 2026?
Yes, becoming a data analyst is a good career choice in 2026 for people willing to build real skills, but the entry market is more competitive than the hype suggests. Demand for data skills keeps growing globally, while Indian employers have become choosier about who they hire.
The good news:
- The WEF Future of Jobs Report 2025 ranks big data specialists as the fastest-growing job in percentage terms, and 86% of surveyed employers expect AI and information processing to transform their business by 2030.
- Analyst skills transfer across almost every industry: banking, retail, healthcare, manufacturing, edtech and IT services.
- AI is making analysts faster, and job postings increasingly ask for AI skills on top of the core stack.
The honest caution:
- Naukri's JobSpeak for September 2026 showed the KPO, Research and Analytics category down 19% year on year.
- That means generic resumes get ignored. Projects, SQL skill and the ability to explain a finding are what get you hired.
For the bigger picture, read our analysis of the AI job market in India.
Now It's Your Turn
A data analyst is a problem-solver who uses data to answer business questions: what happened, why, and what to do next.
You don't need an engineering degree. You need Excel, SQL, a dashboard tool, a few solid projects and the habit of turning numbers into clear recommendations. That is the real answer to what is a data analyst.
So which step are you starting with this week: Excel, SQL or your first dashboard?
If you'd like help choosing a path, book a free career counselling session with the Fireblaze team.
FAQ
What is a data analyst in simple words?
A data analyst is a person who studies a company's data to answer questions like "Why did sales drop?" or "Which product sells best?" and then explains the answer using charts, reports or dashboards so managers can make better decisions.
What does a data analyst do daily?
A data analyst's daily work includes pulling data with SQL or Excel, cleaning it, checking dashboards, analysing trends, preparing reports and presenting findings to managers. Many analysts also attend team meetings to understand business problems.
What is the salary of a data analyst in India?
The average data analyst salary in India is about ₹6.28 lakh per year according to Indeed (October 2026). Entry-level analysts earn around ₹4.13 lakh on average, according to PayScale (July 2026), and top earners make about ₹10 lakh or more.
What qualification is required to become a data analyst?
Any bachelor's degree is usually enough, including BCom, BBA, BSc, BCA, BA or BE. Employers mainly check practical skills in Excel, SQL, Power BI or Tableau, statistics basics and portfolio projects.
Is coding required for a data analyst?
Some coding is required. SQL is essential for most data analyst jobs, and Python is helpful for higher-paying roles. You don't need software-developer-level coding skills.
What is the difference between a data analyst and a data scientist?
A data analyst mainly explains what happened and why using existing data, reports and dashboards. A data scientist builds statistical and machine learning models to predict future outcomes, and usually needs stronger coding and maths skills.
Can a BCom student become a data analyst?
Yes. BCom graduates often make strong data analysts because they understand sales, finance and accounting data. Add Excel, SQL and Power BI skills plus two or three projects, and you can apply for analyst and MIS roles.
Sources
- Indeed India: Data Analyst Salaries, October 2026
- PayScale: Data Analyst Salary in India, July 2026
- Grow with Google: What Is Data Analytics?, April 2025
- World Economic Forum: Future of Jobs Report 2025, fastest growing and declining jobs, January 2025
- Fireblaze AI School: AI Skill Index of India, 2026
- Naukri JobSpeak, September 2026, October 2026
- Indeed India: Data Analyst Jobs in Nagpur, October 2026