 Fireblaze
 Learning Guides
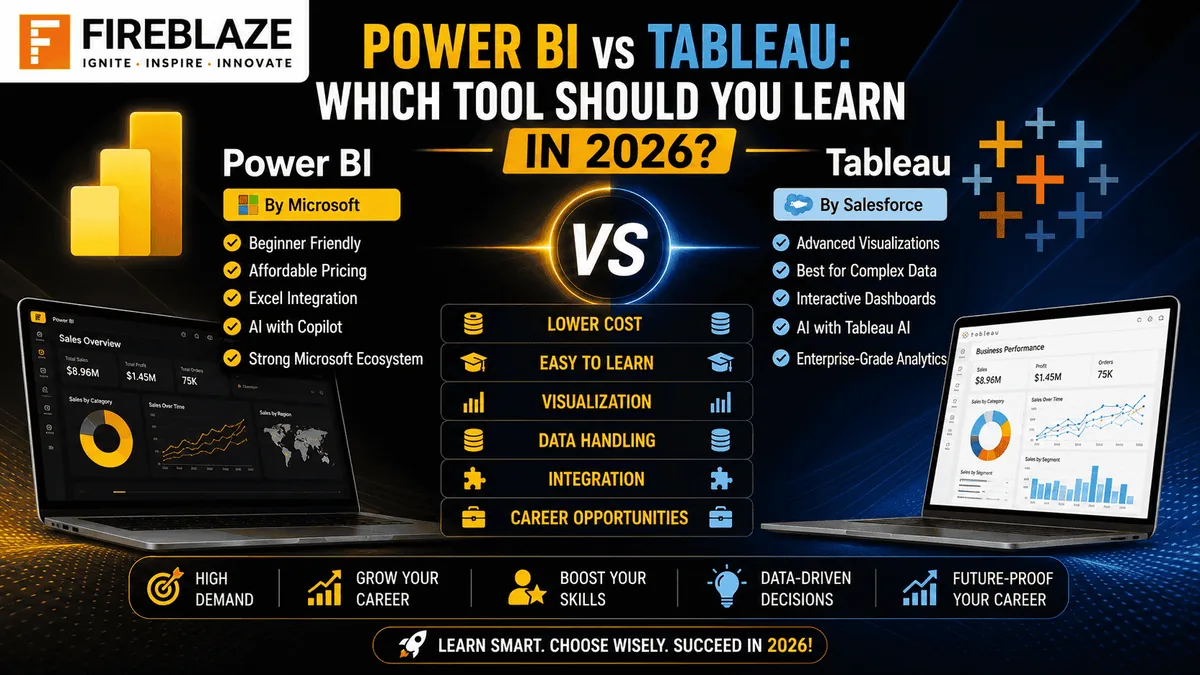
Power BI vs Tableau: Which Tool Should You Learn in 2026?
Introduction
Data has become one of the most valuable assets for businesses, and organizations rely heavily on Business Intelligence tools to transform raw information into meaningful insights. Among the many BI platforms available today, Power BI and Tableau continue to dominate the market. Both tools are widely used by companies to create interactive dashboards, generate reports, analyze business performance, and support data-driven decision-making.
If you are planning to build a career in Data Analytics, Business Intelligence, or Data Science, one question will almost certainly come to mind. Should you learn Power BI or Tableau in 2026? The answer depends on your career goals, learning preferences, industry requirements, and the type of projects you want to work on. While both platforms serve similar purposes, they differ in terms of ease of use, visualization capabilities, pricing, performance, and career opportunities.
In this detailed comparison, we will explore the strengths and weaknesses of both tools to help you make the right decision.
Understanding Power BI
Power BI is Microsoft's Business Intelligence platform designed to help users connect multiple data sources, clean and transform data, build interactive dashboards, and share reports across organizations. Since it integrates seamlessly with Microsoft Excel, SQL Server, Azure, and Microsoft 365, it has become one of the most popular analytics tools used by businesses worldwide.
One of the biggest advantages of Power BI is its beginner-friendly interface. Even users with limited technical knowledge can quickly create professional dashboards using drag-and-drop features. It also offers powerful data modeling capabilities through DAX, allowing analysts to perform advanced calculations and business analysis. Because Microsoft continuously adds new AI-powered features and cloud integrations, Power BI has become an essential tool for modern business intelligence professionals.
Understanding Tableau
Tableau is another leading Business Intelligence platform known for its exceptional data visualization capabilities. It enables users to create visually appealing dashboards, explore complex datasets, and discover hidden trends through interactive visual analysis. Tableau is widely used in industries that require advanced analytics, large-scale reporting, and high-quality visual storytelling.
Unlike Power BI, Tableau focuses heavily on data exploration. Analysts can interact with data in real time, create sophisticated visualizations, and uncover patterns without writing extensive code. Many multinational organizations, consulting firms, financial institutions, and research companies prefer Tableau because of its flexibility and ability to handle complex analytical scenarios.
Ease of Learning
For beginners entering the field of data analytics, Power BI is generally considered easier to learn. Its interface closely resembles other Microsoft products, making navigation familiar for users who already work with Excel. Creating dashboards, connecting data sources, and designing reports requires relatively little effort, allowing beginners to become productive within a few weeks.
Tableau, although user-friendly, has a slightly steeper learning curve. Building advanced visualizations and fully utilizing its analytical capabilities requires a deeper understanding of data relationships and visualization principles. Beginners can certainly learn Tableau, but it usually takes more time to master compared to Power BI.
Data Visualization
Visualization is where Tableau has traditionally excelled. It offers an extensive range of charts, graphs, maps, and interactive visual elements that enable analysts to tell compelling stories with data. Users have greater flexibility in designing customized dashboards, making Tableau a favorite choice for organizations that prioritize presentation quality and visual exploration.
Power BI also provides excellent visualization options and continues to improve with every update. While it includes numerous built-in charts and supports custom visualizations, its primary strength lies in balancing visualization with business reporting rather than focusing solely on design flexibility. For most business applications, Power BI delivers more than enough visualization capabilities.
Data Connectivity and Integration
Both Power BI and Tableau support connections to hundreds of data sources, including Excel files, SQL databases, cloud storage platforms, APIs, enterprise applications, and big data systems. However, Power BI offers a significant advantage for organizations already using Microsoft products. Integration with Excel, Azure, SharePoint, Microsoft Teams, and Dynamics 365 is seamless, making it highly efficient within the Microsoft ecosystem.
Tableau also connects to a wide variety of databases and cloud platforms while providing strong support for enterprise-level environments. It performs exceptionally well when working with diverse and complex data sources across different business systems.
Performance and Scalability
When dealing with small and medium-sized datasets, both platforms perform efficiently. However, as datasets become larger and analytical requirements become more complex, Tableau often delivers faster visualization performance due to its optimized processing engine.
Power BI has significantly improved its performance over the years and can handle large datasets effectively, especially when combined with Microsoft's cloud infrastructure. Organizations using Azure and enterprise Microsoft solutions can scale Power BI to support demanding business requirements without major limitations.
Artificial Intelligence Features
Artificial Intelligence has become an important component of Business Intelligence tools in 2026. Power BI integrates several AI-powered capabilities that allow users to generate automated insights, perform natural language queries, detect anomalies, and build predictive analytics with minimal effort. These features help business users analyze data even without advanced technical expertise.
Tableau also incorporates AI through intelligent recommendations, automated analysis, and predictive modeling. While both platforms continue expanding their AI capabilities, Power BI currently offers stronger integration with Microsoft's growing AI ecosystem.
Pricing Comparison
Pricing plays a major role for students, freelancers, and small businesses. Power BI is widely recognized as one of the most affordable Business Intelligence platforms available today. Its competitive pricing makes enterprise-level analytics accessible to startups, educational institutions, and growing businesses.
Tableau is generally more expensive, especially for organizations requiring multiple user licenses. Although it provides premium visualization capabilities, the higher licensing cost may not be suitable for individuals or small companies with limited budgets.
Career Opportunities in 2026
The demand for Business Intelligence professionals continues to rise as organizations invest more heavily in data-driven decision-making. Companies across healthcare, finance, retail, manufacturing, education, logistics, and technology are actively hiring professionals skilled in dashboard development, reporting, and data visualization.
Power BI has become one of the most requested skills in job postings because thousands of organizations rely on Microsoft technologies. Data Analyst, Business Analyst, Reporting Analyst, and Business Intelligence Developer roles frequently list Power BI as a core requirement.
Tableau remains highly valuable, particularly in multinational corporations, consulting firms, research organizations, and enterprises that prioritize advanced analytics and visual storytelling. Professionals with Tableau expertise often work on complex business intelligence projects requiring sophisticated dashboard development and deep analytical exploration.
Learning either platform can significantly improve your career prospects, but Power BI currently offers a larger number of opportunities due to its widespread adoption and cost-effectiveness.
Which Tool Should Beginners Choose?
If you are completely new to Business Intelligence and data analytics, Power BI is generally the better starting point. It is easier to learn, more affordable, integrates seamlessly with Microsoft products, and offers excellent career opportunities. The growing demand for Power BI professionals makes it one of the safest choices for beginners entering the analytics industry.
However, if your goal is to specialize in advanced data visualization, enterprise analytics, or consulting, Tableau is an excellent investment. Its visualization capabilities remain among the best in the industry, and professionals with strong Tableau skills continue to be highly valued by large organizations.
Many experienced data analysts eventually learn both tools. Since the core concepts of Business Intelligence remain the same, transitioning from one platform to the other becomes much easier once you understand data modeling, dashboard design, and reporting principles.
Final Verdict
Choosing between Power BI and Tableau in 2026 is not about determining which tool is universally better but rather which one aligns more closely with your career goals. Power BI stands out for its affordability, ease of learning, Microsoft integration, and rapidly growing job market. Tableau continues to lead in advanced data visualization, analytical flexibility, and enterprise reporting.
For most beginners, students, and professionals starting a career in data analytics, Power BI offers the fastest learning path and the highest return on investment. As your experience grows, adding Tableau to your skill set can further strengthen your profile and open opportunities with global organizations. Mastering either tool will help you build valuable analytical skills, but learning both over time will make you a more versatile and competitive data professional in the evolving world of Business Intelligence.
Keep Reading
Related Articles
Learning Guides
Language Translation Using Deep Learning: A Complete Guide
Discover how Deep Learning powers modern language translation systems. Learn Neural Machine Translation, Transformer models, Seq2Seq architecture, applications,
Python 3.9: Features, Improvements, and Complete Beginner's Guide
Python 3.9 introduced several powerful enhancements that improve developer productivity, code readability, and application performance. From dictionary merge op
Data Science Learning Hub: Tutorials, Interview Questions, Projects & Career Resources
Explore Data Science tutorials, Machine Learning guides, Python and SQL resources, interview questions, projects, career roadmaps, analytics concepts, and AI le