 Fireblaze
 Learning Guides
Outlier Detection and Treatment in Data Analysis
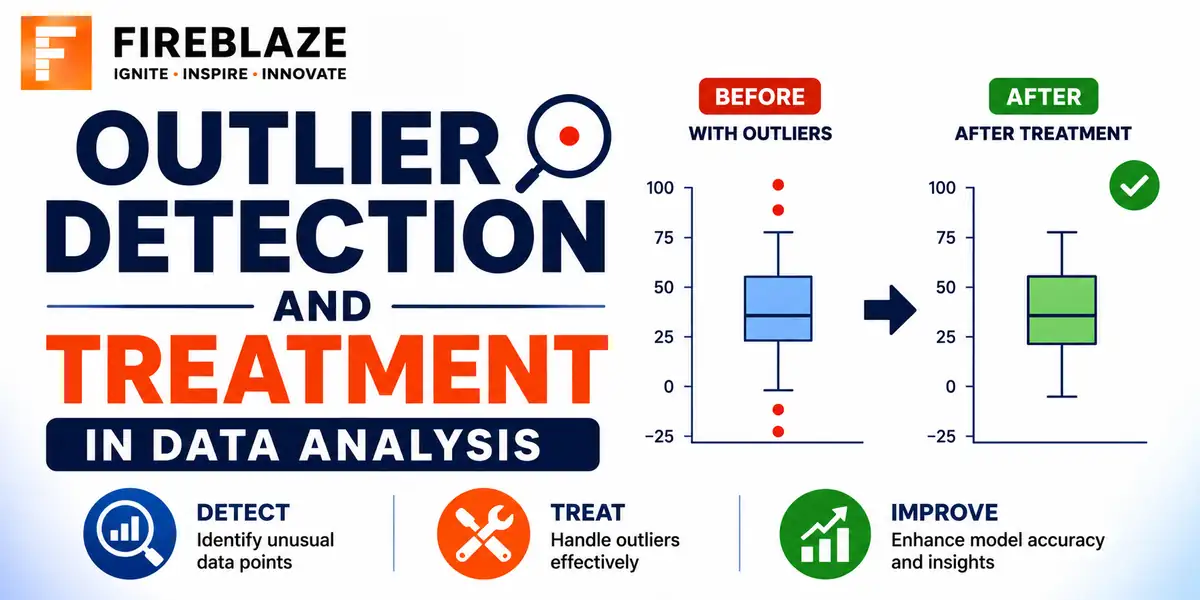
Quick answer: Learn how to detect outliers using IQR, Z-score and visualisation methods, and the common treatment strategies including removal, capping and transformation.
What is an Outlier?
An outlier is a data point that differs substantially from the rest of the dataset. It may reflect a genuine, unusual observation, or it may be the result of a data entry or measurement error, and distinguishing between the two matters a great deal for how it should be handled.
Detecting Outliers with the IQR Method
The Interquartile Range (IQR) method flags any value falling far outside the middle 50 percent of the data.
import pandas as pd

Q1 = df['income'].quantile(0.25)
Q3 = df['income'].quantile(0.75)
IQR = Q3 - Q1

lower_bound = Q1 - 1.5 * IQR
upper_bound = Q3 + 1.5 * IQR

outliers = df[(df['income'] < lower_bound) | (df['income'] > upper_bound)]
Detecting Outliers with Z-Score
The Z-score method flags values that fall an unusually large number of standard deviations away from the mean, commonly beyond 3.
from scipy import stats
import numpy as np

z_scores = np.abs(stats.zscore(df['income']))
outliers = df[z_scores > 3]
The Z-score method assumes the data is roughly normally distributed, and can itself be distorted by extreme outliers, since they affect the mean and standard deviation it depends on.
Detecting Outliers Visually
import seaborn as sns

sns.boxplot(x=df['income'])
sns.scatterplot(x=df['age'], y=df['income'])
A box plot shows the IQR bounds directly, with outliers plotted as individual points beyond the whiskers. A scatter plot can reveal outliers that only become apparent when considering two variables together.
Outlier Treatment Strategies
1. Investigate before treating
Always check whether an outlier is a genuine data entry error, such as an age of 250, versus a real, unusual observation, such as a genuinely very high earner, since the correct treatment differs entirely.
2. Removal
df_cleaned = df[(df['income'] >= lower_bound) & (df['income'] <= upper_bound)]
Appropriate for confirmed data errors, but risky for genuine extreme values, since removing them can bias the analysis by hiding real variation.
3. Capping (Winsorization)
df['income_capped'] = df['income'].clip(lower=lower_bound, upper=upper_bound)
Replaces extreme values with the nearest boundary value rather than deleting them entirely, keeping the row while limiting the outlier's influence on the analysis.
4. Transformation
import numpy as np

df['income_log'] = np.log1p(df['income'])
A log transformation compresses the scale of extreme values, often reducing their disproportionate influence without discarding any data at all.
5. Using a robust model
Some models, such as tree-based algorithms, are naturally less sensitive to outliers than models like linear regression, so choosing a robust model can sometimes be a better solution than modifying the data itself.
Common Interview Questions
What is the difference between the IQR and Z-score methods for detecting outliers?
IQR is based on quartiles and works well regardless of the data's distribution shape. Z-score assumes an approximately normal distribution and can itself be skewed by very extreme outliers affecting the mean.
Should you always remove outliers?
No. A genuine, correctly recorded extreme value can carry real, meaningful information, and removing it can bias the analysis. The decision should follow investigation of the outlier's cause, not an automatic rule.
FAQ
Frequently Asked Questions
What is an outlier in data analysis?
A data point that differs substantially from the rest of the dataset, which may reflect a genuine unusual observation or a data entry or measurement error.
How do you detect outliers using the IQR method?
Calculate the interquartile range between the first and third quartiles, then flag any value falling more than 1.5 times that range below the first quartile or above the third quartile.
Should outliers always be removed?
No. A genuine, correctly recorded extreme value can carry meaningful information. The decision should follow investigating the outlier's cause, not an automatic removal rule.
What is Winsorization?
A technique that caps extreme values at a defined boundary rather than removing them entirely, limiting an outlier's influence while keeping the data point in the dataset.
Keep Reading
Related Articles
Learning Guides
INNER JOIN in SQL with Examples: Complete Beginner's Guide
Learn INNER JOIN in SQL with practical examples, syntax, interview questions, and real-world use cases. A complete beginner-friendly SQL JOI
Learning Guides
OUTER JOIN in SQL: Complete Guide with Examples for Beginners
Master OUTER JOIN in SQL with practical examples and real-world scenarios. Learn LEFT JOIN, RIGHT JOIN, FULL OUTER JOIN, syntax, use cases,
Learning Guides
Multi-Row Functions in SQL: Complete Guide with Examples
Learn multi-row (aggregate) functions in SQL including SUM, AVG, COUNT, MIN, MAX, GROUP BY and HAVING, with practical examples, NULL handlin