 Fireblaze
 Learning Guides
Covariance and Correlation in Machine Learning Explained
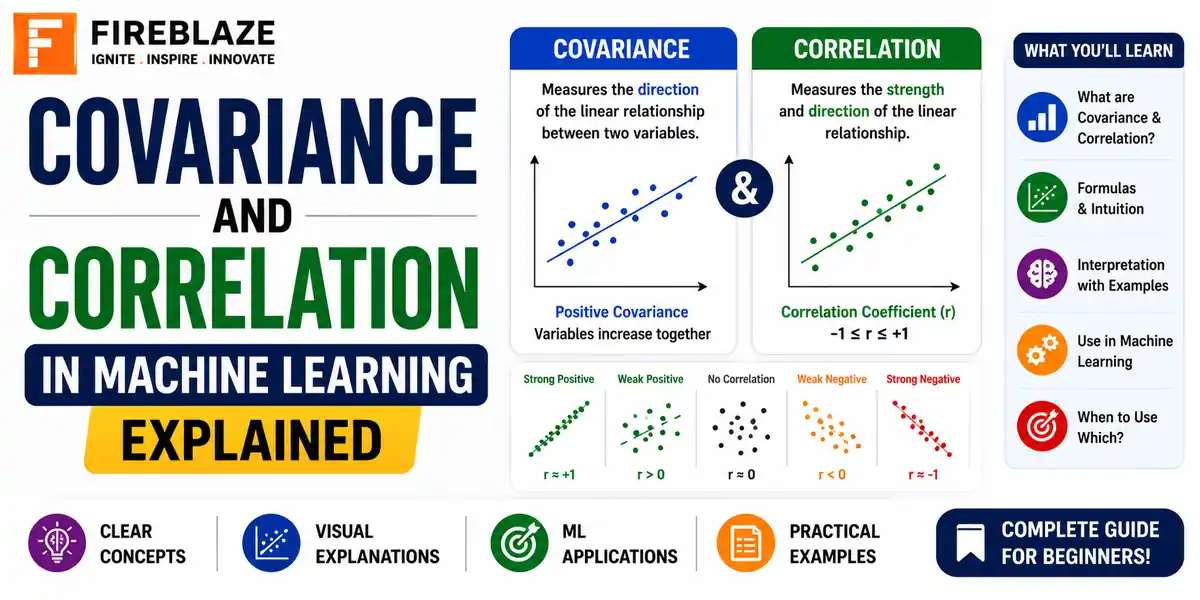
Quick answer: Understand covariance and correlation in Machine Learning, including formulas, the key differences, Pearson and Spearman, multicollinearity and interview questions.
Covariance and correlation both describe how two variables move in relation to each other. They are closely related, frequently confused, and both appear regularly in Data Science interviews.
The short version: covariance tells you the direction of a relationship, correlation tells you the direction and the strength on a fixed, comparable scale.
In this guide you will learn:
What covariance is
What correlation is
The exact difference between them
Pearson and Spearman correlation
Why correlation does not imply causation
How both are used in Machine Learning
Interview questions
What is Covariance?
Covariance measures how two variables vary together.
Positive covariance: when one variable increases, the other tends to increase
Negative covariance: when one increases, the other tends to decrease
Covariance near zero: no consistent linear relationship
Formula
Cov(X, Y) = Σ (Xi - X̄)(Yi - Ȳ) / (n - 1)
Where X̄ and Ȳ are the means of X and Y, and n is the number of observations.
The problem with covariance
Covariance is unbounded and depends entirely on the units of the variables. A covariance of 5000 sounds large, but it is meaningless without knowing the scale.
If you measure height in centimetres instead of metres, the covariance changes by a factor of 100 even though the underlying relationship has not changed at all. This makes covariance values impossible to compare across different pairs of variables.
What is Correlation?
Correlation solves that problem by standardising covariance. It divides covariance by the product of the two standard deviations, producing a value that always falls between -1 and +1.
Formula
Corr(X, Y) = Cov(X, Y) / (σX × σY)
Interpreting the value
| Correlation value | Interpretation |
|---|---|
| +1 | Perfect positive linear relationship |
| +0.7 to +0.9 | Strong positive |
| +0.4 to +0.6 | Moderate positive |
| 0 | No linear relationship |
| -0.4 to -0.6 | Moderate negative |
| -1 | Perfect negative linear relationship |
Because the scale is fixed, correlation values can be compared directly across completely different variable pairs.
Covariance vs Correlation
| Covariance | Correlation |
|---|---|
| Shows direction only | Shows direction and strength |
| Unbounded range | Always between -1 and +1 |
| Depends on units | Unitless |
| Changes if you rescale a variable | Unaffected by rescaling |
| Hard to interpret alone | Directly interpretable |
Calculating Both in Python
import pandas as pd

df = pd.DataFrame({
    'study_hours': [2, 4, 6, 8, 10],
    'exam_score':  [55, 62, 71, 78, 88]
})

# Covariance matrix
print(df.cov())

# Correlation matrix
print(df.corr())
The correlation here is close to +1, indicating a strong positive linear relationship. The covariance shows the same direction, but the raw number is far harder to interpret on its own.
Pearson vs Spearman Correlation
Pearson correlation is the default, but it is not always the right choice.
| Pearson | Spearman |
|---|---|
| Measures linear relationships | Measures monotonic relationships |
| Uses actual values | Uses ranks |
| Sensitive to outliers | More robust to outliers |
| Assumes roughly continuous data | Works with ordinal data |
df.corr(method='pearson')   # default
df.corr(method='spearman')  # rank based
If a relationship is clearly curved but consistently increasing, Pearson may report a weak correlation while Spearman correctly identifies a strong one.
Correlation Does Not Imply Causation
This is the most important caveat, and it is tested constantly.
A strong correlation between two variables can arise from:
X genuinely causing Y
Y genuinely causing X
A third variable causing both, known as a confounder
Pure coincidence, especially when testing many variable pairs
Ice cream sales and drowning incidents correlate strongly. Neither causes the other. Temperature drives both. Establishing causation requires a controlled experiment or careful causal inference methods, not a correlation coefficient.
Why These Matter in Machine Learning
1. Feature selection
Features with near zero correlation to the target often carry little predictive signal for linear models. Note the caveat: correlation only captures linear relationships, so a feature with zero correlation may still be highly predictive in a tree based or non-linear model.
2. Detecting multicollinearity
When two input features are strongly correlated with each other, typically above 0.8 or 0.9, they carry largely the same information. In linear regression this makes coefficients unstable and hard to interpret, since the model cannot separate their individual effects.
Common responses include dropping one of the pair, combining them into a single feature, or using dimensionality reduction such as PCA.
import seaborn as sns
import matplotlib.pyplot as plt

corr_matrix = df.corr()
sns.heatmap(corr_matrix, annot=True, cmap='coolwarm')
plt.show()
A correlation heatmap is one of the fastest ways to spot redundant features during exploratory analysis.
3. Principal Component Analysis
PCA works directly on the covariance matrix of the data. It finds directions of maximum variance and creates uncorrelated components, which is why it is an effective remedy for multicollinearity.
4. Data leakage detection
A feature with a suspiciously high correlation to the target, for example above 0.95, is often a warning sign rather than good news. It frequently means the feature contains information that would not be available at prediction time.
Limitations to Keep in Mind
Both measures capture only linear or monotonic relationships and can miss genuine non-linear patterns
Both are sensitive to outliers, particularly Pearson correlation
A correlation of zero means no linear relationship, not no relationship
Correlation between two features says nothing about their combined effect in a model
Anscombe's quartet is the classic demonstration: four datasets with nearly identical correlation values that look completely different when plotted. Always visualise your data rather than trusting a single coefficient.
Common Interview Questions
What is the difference between covariance and correlation?
Both measure how two variables move together. Covariance shows only direction and depends on units. Correlation is standardised, ranges from -1 to +1, is unitless, and shows both direction and strength.
Can correlation be zero when a relationship exists?
Yes. A perfectly symmetric curved relationship, such as a U shape, can produce a Pearson correlation near zero despite a strong underlying relationship. This is why plotting the data matters.
What is multicollinearity and why is it a problem?
Multicollinearity occurs when input features are highly correlated with each other. It makes regression coefficients unstable and difficult to interpret, though it usually affects interpretation more than raw predictive accuracy.
When would you use Spearman instead of Pearson?
When the relationship is monotonic but not linear, when the data is ordinal, or when outliers would unduly influence a Pearson calculation.
Does high correlation with the target always mean a good feature?
No. Very high correlation can indicate data leakage, where a feature encodes the answer and will not be available at prediction time.
Final Thoughts
Covariance and correlation are simple to compute and easy to misread. Remember the essentials: covariance gives direction, correlation gives direction and strength on a comparable scale, and neither one establishes causation.
In practice, use a correlation heatmap early in exploratory analysis to understand relationships and spot redundant features, then always plot the variables before drawing conclusions from a single number.
FAQ
Frequently Asked Questions
What is the difference between covariance and correlation?
Both measure how two variables move together. Covariance shows only direction and depends on units. Correlation is standardised, ranges from -1 to +1, and shows both direction and strength.
Can correlation be zero when a relationship exists?
Yes. A perfectly symmetric curved relationship can produce a Pearson correlation near zero despite a strong underlying relationship, which is why plotting the data matters.
What is multicollinearity and why is it a problem?
Multicollinearity occurs when input features are highly correlated with each other, making regression coefficients unstable and difficult to interpret.
When would you use Spearman instead of Pearson?
When the relationship is monotonic but not linear, when the data is ordinal, or when outliers would unduly influence a Pearson calculation.
Keep Reading
Related Articles
Learning Guides
INNER JOIN in SQL with Examples: Complete Beginner's Guide
Learn INNER JOIN in SQL with practical examples, syntax, interview questions, and real-world use cases. A complete beginner-friendly SQL JOI
Learning Guides
OUTER JOIN in SQL: Complete Guide with Examples for Beginners
Master OUTER JOIN in SQL with practical examples and real-world scenarios. Learn LEFT JOIN, RIGHT JOIN, FULL OUTER JOIN, syntax, use cases,
Interview Preparation
Top 50 SQL Interview Questions and Answers for Freshers SQL Interview Questions
Preparing for an SQL interview can be challenging, especially for freshers entering the tech industry. This guide covers the Top 50 SQL Inte