 Fireblaze
 Learning Guides
Assumptions of Linear Regression: Complete Guide with Examples
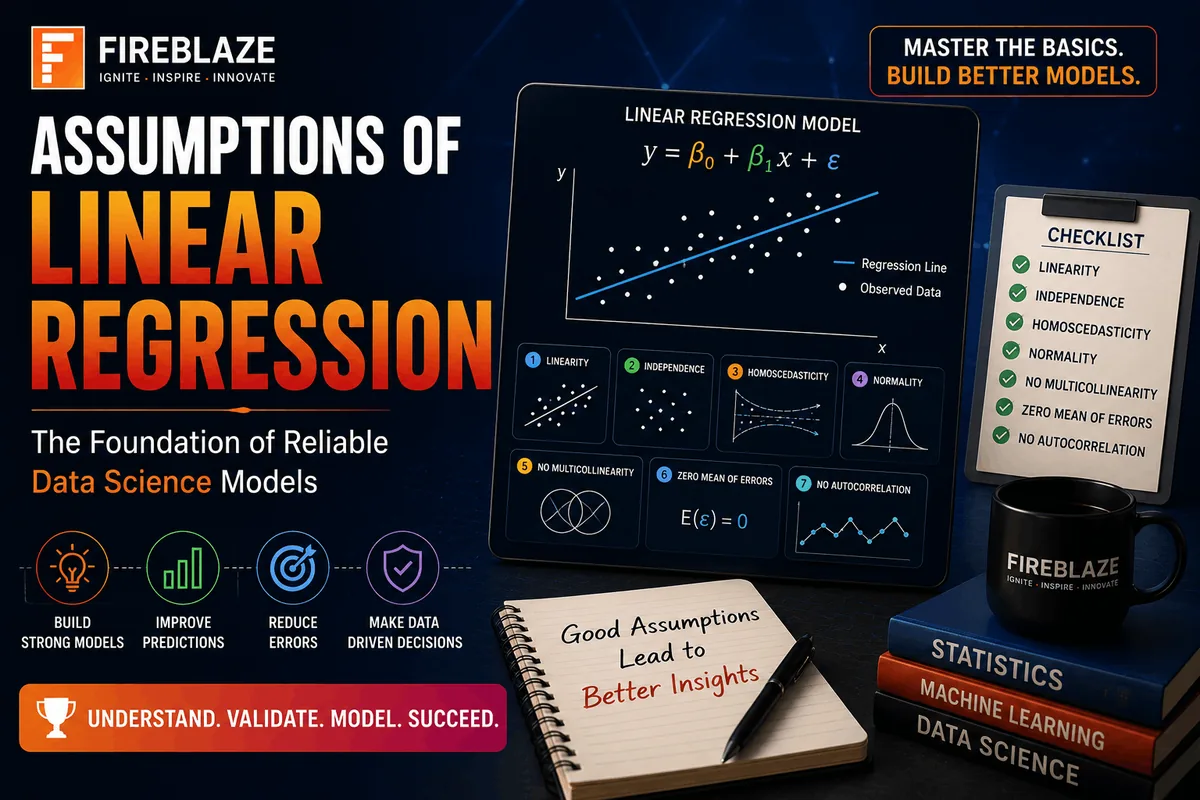
Linear Regression is one of the most fundamental algorithms in Statistics, Data Analytics, and Machine Learning. It is widely used to predict numerical values and understand relationships between variables.
However, before applying a Linear Regression model, certain assumptions must be satisfied. Violating these assumptions can lead to inaccurate predictions, unreliable coefficients, and misleading conclusions.
In this guide, you'll learn:
What Linear Regression is
Why assumptions matter
Key assumptions of Linear Regression
Examples and practical applications
Methods for testing assumptions
Interview questions
What is Linear Regression?
Linear Regression is a supervised machine learning algorithm used to predict a continuous target variable based on one or more independent variables.
The basic equation is:
Y = β0 + β1X + ε
Where:
Y = Dependent Variable
X = Independent Variable
β0 = Intercept
β1 = Coefficient
ε = Error Term
Example:
Predicting house prices based on area.
Why Are Assumptions Important?
Linear Regression relies on mathematical assumptions.
If these assumptions are violated:
Predictions may become inaccurate
Coefficients may be biased
Statistical tests become unreliable
Model interpretation becomes difficult
Therefore, checking assumptions is a critical step in model building.
Main Assumptions of Linear Regression
The major assumptions include:
Linearity
Independence of Errors
Homoscedasticity
Normality of Residuals
No Multicollinearity
No Significant Outliers
Assumption 1: Linearity
The relationship between independent variables and the dependent variable should be linear.
Example:
House Price increases as Area increases.
A straight-line relationship should exist.
Why is Linearity Important?
Linear Regression assumes:
Change in X produces proportional change in Y.
If the relationship is non-linear, the model may underperform.
How to Check Linearity?
Methods:
Scatter Plot
Residual Plot
Correlation Analysis
A scatter plot should show an approximately straight-line pattern.
Assumption 2: Independence of Errors
Residuals should be independent of each other.
Residual:
Residual = Actual Value − Predicted Value
Errors from one observation should not influence another observation.
Example
Stock prices observed over time often violate independence because today's value depends on yesterday's value.
How to Test Independence?
Common test:
Durbin-Watson Test
Interpretation:
| Value | Meaning |
|---|---|
| Around 2 | No autocorrelation |
| Less than 2 | Positive autocorrelation |
| Greater than 2 | Negative autocorrelation |
Assumption 3: Homoscedasticity
Homoscedasticity means the variance of residuals remains constant across all levels of independent variables.
Example
Good Model:
Residuals are evenly spread.
Bad Model:
Residual spread increases with predictions.
This issue is called:
Heteroscedasticity
Why is Homoscedasticity Important?
Violations may result in:
Incorrect confidence intervals
Unreliable hypothesis tests
Biased standard errors
How to Check Homoscedasticity?
Methods:
Residual Plot
Breusch-Pagan Test
White Test
A random scatter of residuals indicates homoscedasticity.
Assumption 4: Normality of Residuals
Residuals should follow a normal distribution.
Important:
The dependent variable itself does not need to be normally distributed.
Only residuals should be approximately normal.
Why is Normality Important?
Normal residuals improve:
Confidence Intervals
Hypothesis Testing
Statistical Validity
How to Check Normality?
Methods:
Histogram
Q-Q Plot
Shapiro-Wilk Test
A bell-shaped residual distribution indicates normality.
Assumption 5: No Multicollinearity
Independent variables should not be highly correlated with each other.
Example
Suppose a dataset contains:
Monthly Salary
Annual Salary
These variables are highly correlated.
This creates multicollinearity.
Why is Multicollinearity a Problem?
It can cause:
Unstable coefficients
Difficulty interpreting variables
Reduced model reliability
How to Detect Multicollinearity?
Methods:
Correlation Matrix
High correlation indicates potential issues.
Variance Inflation Factor (VIF)
Interpretation:
| VIF Value | Meaning |
|---|---|
| Less than 5 | Acceptable |
| 5 to 10 | Moderate Concern |
| Greater than 10 | Serious Multicollinearity |
Assumption 6: No Significant Outliers
Outliers are extreme observations that differ substantially from the majority of data.
Example
House Prices:
200,000
250,000
220,000
15,000,000
The last value is an outlier.
Why Are Outliers Dangerous?
Outliers can:
Distort regression lines
Bias coefficients
Reduce predictive accuracy
How to Detect Outliers?
Methods:
Box Plots
Z-Score
IQR Method
Cook's Distance
Residual Analysis in Linear Regression
Residual analysis helps validate assumptions.
Residuals should:
Have constant variance
Be normally distributed
Show no clear pattern
Be independent
Residual plots are among the most useful diagnostic tools.
Example of Assumptions in Real-World Projects
Suppose you're predicting employee salaries.
Independent Variables:
Experience
Education
Skills
Target Variable:
Salary
Before building the model, verify:
✅ Linear relationship exists
✅ Errors are independent
✅ Residual variance is constant
✅ Residuals are normally distributed
✅ No multicollinearity
✅ No extreme outliers
Only then should the model be deployed.
Common Interview Questions
What Are the Assumptions of Linear Regression?
The major assumptions are:
Linearity
Independence
Homoscedasticity
Normality
No Multicollinearity
No Significant Outliers
What is Homoscedasticity?
Constant variance of residuals across all predictions.
What is Multicollinearity?
High correlation between independent variables.
What is VIF?
Variance Inflation Factor measures multicollinearity.
What Happens if Assumptions Are Violated?
Possible consequences include:
Biased coefficients
Poor predictions
Invalid statistical conclusions
How to Handle Violations
Non-Linearity
Solutions:
Polynomial Regression
Feature Transformation
Log Transformation
Heteroscedasticity
Solutions:
Log Transformation
Weighted Regression
Robust Standard Errors
Multicollinearity
Solutions:
Remove correlated variables
Feature Selection
Principal Component Analysis (PCA)
Outliers
Solutions:
Remove outliers
Transform data
Use robust regression methods
Advantages of Checking Assumptions
Benefits include:
Improved model accuracy
Reliable predictions
Better interpretability
Strong statistical validity
Enhanced business decision-making
Linear Regression in Data Science
Linear Regression is widely used for:
Sales Forecasting
Revenue Prediction
Demand Forecasting
Price Estimation
Risk Modeling
Business Analytics
Understanding assumptions ensures these models remain reliable and effective.
Final Thoughts
Linear Regression remains one of the most important algorithms in Statistics, Data Science, and Machine Learning. However, its success depends on satisfying key assumptions such as linearity, independence of errors, homoscedasticity, normality of residuals, absence of multicollinearity, and minimal outlier influence.
By understanding and validating these assumptions before model deployment, Data Scientists can build accurate, interpretable, and statistically sound predictive models that drive meaningful business insights and better decision-making.
Keep Reading
Related Articles
Learning Guides
Introduction to Computer Vision: A Beginner’s Guide
Discover the basics of Computer Vision, a rapidly growing field of Artificial Intelligence that enables machines to understand images and videos. Expl
All About PyCaret: Conversation with Mr. Moez Ali and Mr. Aniruddha Kalbande | EP-06
Explore PyCaret and its impact on machine learning development through an insightful conversation with PyCaret creator Moez Ali and AI expert Aniruddh
What is Data Mining? Complete Guide for Beginners
Learn what Data Mining is, how it works, key techniques, tools, applications, advantages, challenges, and its role in Data Science, Machine Learning,