 Fireblaze
 Interview Preparation
Statistics Interview Questions and Answers for Data Science and Analytics (2026 Guide)
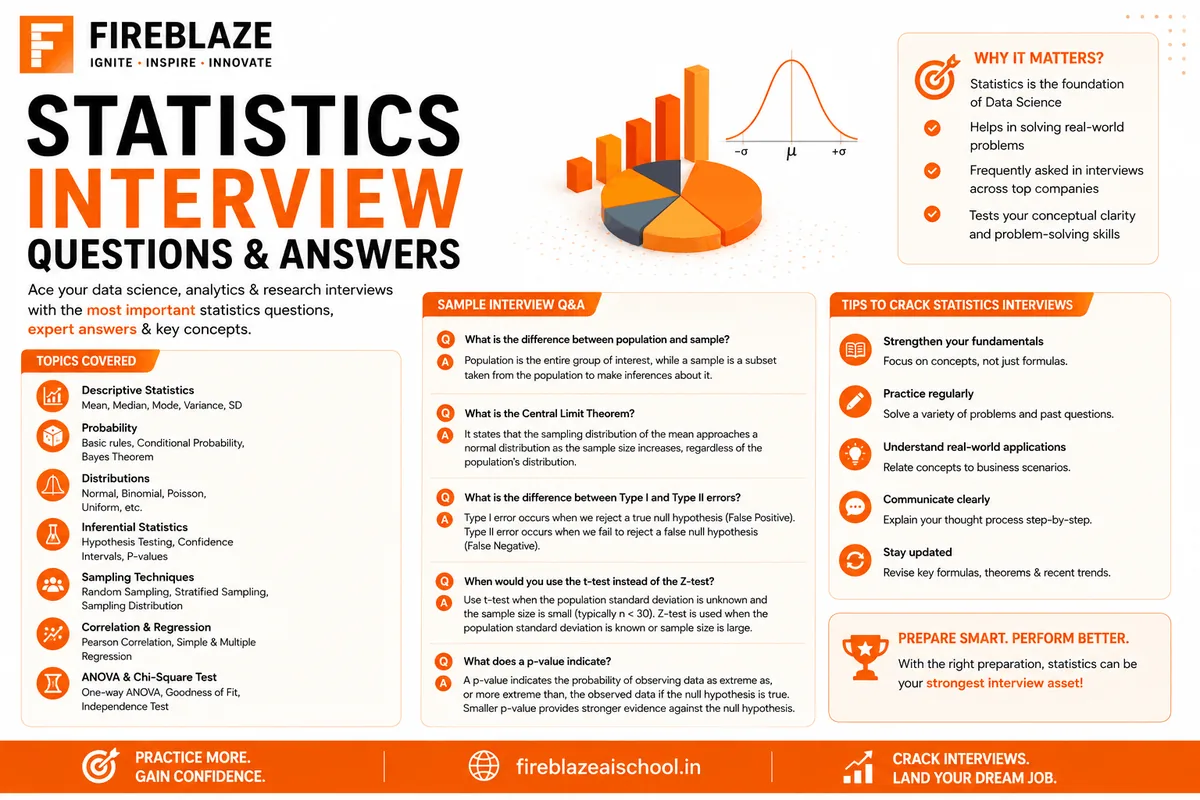
Statistics is one of the most important pillars of Data Science, Machine Learning, Artificial Intelligence, and Data Analytics. Almost every Data Science interview includes statistical concepts because they help professionals analyze data, validate assumptions, and make informed decisions.
Whether you're preparing for a Data Analyst, Data Scientist, Machine Learning Engineer, or Business Analyst role, mastering statistics is essential.
In this guide, we'll cover the most commonly asked Statistics interview questions and answers.
Why Statistics is Important in Data Science
Statistics helps professionals:
Analyze data
Identify patterns
Build predictive models
Perform hypothesis testing
Validate machine learning models
Make business decisions
Without statistics, data-driven decision-making becomes difficult.
Basic Statistics Interview Questions
1. What is Statistics?
Statistics is the science of collecting, analyzing, interpreting, and presenting data.
It helps transform raw data into meaningful insights.
2. What are the Different Types of Statistics?
Descriptive Statistics
Describes and summarizes data.
Examples:
Mean
Median
Mode
Standard Deviation
Inferential Statistics
Draws conclusions about a population based on sample data.
Examples:
Hypothesis Testing
Confidence Intervals
Regression Analysis
3. What is Mean?
Mean is the average value of a dataset.
Formula:
Mean = Sum of Observations / Number of Observations
Example:
2, 4, 6, 8

Mean = 5
4. What is Median?
Median is the middle value after arranging data in ascending order.
Example:
1, 3, 5, 7, 9

Median = 5
5. What is Mode?
Mode is the most frequently occurring value.
Example:
2, 2, 3, 4, 5

Mode = 2
Probability Questions
6. What is Probability?
Probability measures the likelihood of an event occurring.
Formula:
Probability =
Favorable Outcomes /
Total Outcomes
Range:
0 to 1
7. What is Conditional Probability?
Conditional Probability is the probability of an event occurring given that another event has already occurred.
Formula:
P(A|B)
8. What is Bayes' Theorem?
Bayes' Theorem calculates conditional probabilities.
Formula:
P(A|B) =
[P(B|A) × P(A)] / P(B)
Widely used in:
Spam Detection
Medical Diagnosis
Machine Learning
Measures of Dispersion
9. What is Variance?
Variance measures how far data points are spread from the mean.
Low variance:
Data is closely grouped.
High variance:
Data is widely spread.
10. What is Standard Deviation?
Standard Deviation is the square root of variance.
It measures data variability.
Applications include:
Risk Analysis
Forecasting
Machine Learning
11. What is Range?
Range measures the difference between maximum and minimum values.
Formula:
Range = Max - Min
Distribution Questions
12. What is Normal Distribution?
Normal Distribution is a bell-shaped probability distribution where:
Mean = Median = Mode
Characteristics:
Symmetrical
Predictable
Common in real-world datasets
13. What is Skewness?
Skewness measures asymmetry in data distribution.
Positive Skew
Tail extends to the right.
Negative Skew
Tail extends to the left.
14. What is Kurtosis?
Kurtosis measures the heaviness of distribution tails.
Types:
Mesokurtic
Leptokurtic
Platykurtic
Hypothesis Testing Questions
15. What is Hypothesis Testing?
A statistical method used to determine whether an assumption about a population is valid.
16. What is Null Hypothesis (H₀)?
The default assumption that no significant difference exists.
Example:
New Marketing Campaign
has no impact on sales.
17. What is Alternative Hypothesis (H₁)?
The assumption that a significant difference exists.
18. What is P-Value?
P-value measures the probability of observing results if the null hypothesis is true.
Common threshold:
P < 0.05
19. What is Type I Error?
Type I Error occurs when:
Null Hypothesis is true
But rejected
Also called:
False Positive
20. What is Type II Error?
Type II Error occurs when:
Null Hypothesis is false
But accepted
Also called:
False Negative
Correlation and Regression
21. What is Correlation?
Correlation measures the relationship between two variables.
Range:
-1 to +1
Positive Correlation
Variables move together.
Negative Correlation
Variables move in opposite directions.
22. What is Pearson Correlation?
Pearson Correlation measures linear relationships between variables.
Most commonly used correlation technique.
23. What is Regression Analysis?
Regression predicts the relationship between dependent and independent variables.
Applications:
Sales Forecasting
Risk Prediction
Customer Analytics
24. What is Linear Regression?
Linear Regression models relationships using a straight line.
Equation:
Y = a + bX
Sampling Questions
25. What is Sampling?
Sampling involves selecting a subset of data from a population.
26. Why is Sampling Important?
Benefits:
Reduces Cost
Saves Time
Improves Efficiency
27. Types of Sampling
Random Sampling
Every observation has equal probability.
Stratified Sampling
Population divided into groups.
Systematic Sampling
Selection at fixed intervals.
Central Limit Theorem
28. What is Central Limit Theorem (CLT)?
The Central Limit Theorem states that as sample size increases, the distribution of sample means approaches a normal distribution regardless of the original population distribution.
CLT is fundamental in Data Science and Statistical Inference.
Confidence Interval
29. What is a Confidence Interval?
A confidence interval provides a range likely to contain the true population parameter.
Example:
95% Confidence Interval:
(48%, 52%)
Machine Learning Related Statistics Questions
30. What is Bias?
Bias refers to errors caused by overly simple assumptions.
Results in:
Underfitting
31. What is Variance?
Variance refers to sensitivity to training data.
Results in:
Overfitting
32. What is Bias-Variance Tradeoff?
The balance between:
Underfitting
Overfitting
A good model minimizes both.
Scenario-Based Questions
33. Sales Increased After a Marketing Campaign. How Would You Verify Effectiveness?
Approach:
Define Hypotheses
Collect Data
Perform Statistical Test
Calculate P-Value
Draw Conclusions
34. How Would You Detect Outliers?
Methods:
Box Plots
Z-Score
IQR Method
35. Why are Outliers Important?
Outliers can:
Distort Results
Affect Models
Reveal Important Business Events
Statistics Interview Tips
Focus on Fundamentals
Master:
Mean
Median
Mode
Variance
Standard Deviation
Learn Probability
Understand:
Bayes Theorem
Conditional Probability
Probability Distributions
Practice Hypothesis Testing
Frequently asked in interviews.
Connect Statistics to Business Problems
Interviewers often test practical applications rather than theory alone.
Statistics Roadmap for Data Science
Recommended learning path:
Descriptive Statistics
Probability
Distributions
Hypothesis Testing
Correlation
Regression
Sampling
Statistical Inference
Experimental Design
Machine Learning Statistics
Final Thoughts
Statistics forms the backbone of Data Science, Machine Learning, and Analytics. A strong understanding of statistical concepts helps professionals make data-driven decisions, build reliable models, and solve real-world business problems.
Mastering these Statistics interview questions will significantly improve your confidence and increase your chances of succeeding in Data Science and Analytics interviews.
Keep Reading
Related Articles
Interview Preparation
The Coca-Cola Company Data Science Interview Questions and Answers (2026 Guide)
The Coca-Cola Company is one of the world's largest beverage companies, leveraging Data Science, Artificial Intelligence, Machine Learning, Predictive
Huawei Technologies Data Science Interview Questions and Answers (2026 Guide)
Huawei Technologies is a global leader in telecommunications, cloud computing, artificial intelligence, networking, and digital transformation solutio
Convergytics Data Analytics Interview Questions and Answers
Explore the most commonly asked Convergytics Data Analytics interview questions and answers covering SQL, Python, statistics, customer analytics, mark