Table of Contents
Introduction To Top Data Analysis Tools
In This Article, We Are Going to Discuss Top Data Analysis Tools. Enterprises of the present decade have understood the importance of making data-driven decisions. Data analysis is the technique of transforming unstructured data to generate valuable statistics and insights. It has become the bedrock of modern business operations. Data in itself is just raw information. Data analysis assembles, transforms helps visualize the data into useful information for businesses.
With the exceeding amount of data that is being generated, there are also that many analysis tools available. Data analysis tools are specifically designed software used by data scientists to perform analysis and data mining tasks.
Choosing the right tool can also be a challenge for data analysts. Depending on a company’s needs, objectives, and what type of data needs to be analyzed, we have rounded up the Top 10 Data Analysis tools available.
Excel
Microsoft Excel has been around for around three decades. And rightly so, since it serves as a one-stop application for storing, analyzing, and transforming data. Microsoft Excel provides a spreadsheet solution for any type of business. In a matter of a few clicks, you can perform complex statistical calculations and create visually appealing charts. Professionals who are not technically inclined use Excel. Consider it as the godfather of Analysis Tools!
The Data Analysis Toolpak feature in Excel offers a wide range of options to perform statistical analysis of your data. Charts and graphs created in excel give a clear interpretation and visualization of data. The widespread use of Excel and its popularity make it a go-to data analysis tool.

| Advantages | Disadvantages |
| Easily evaluate quantitative data | Not scalable over large data |
| Filter data and pivot tables with ease | Lack of control and security. |
| Use inbuilt equations and create complex ones of your own | Not designed for collaborative use |
Widget not in any sidebars
Power BI
Power BI is another product by Microsoft that is worthy of mentioning in this list. Microsoft Power BI is a leading business intelligence application that offers support for a variety of data sources. This Data analytics tool allows users to create reports and dashboards and publish them. It also enables some features of machine learning with the help of Azure Machine Learning tool.
Power BI is a user-friendly tool offering stunning drag-and-drop features for making charts and easy-to-use functions. It can be deployed in-house or on the cloud depending on business requirements.
| Advantages | Disadvantages |
| Can be used by businesses with no warehouses | With increasing data (more than 2 GB), it becomes expensive |
| Collaborative dashboards and wide variety of charts and reports | Cannot perform complex calculations |
| Use inbuilt equations and create complex ones of your own | Bulky user interface that takes time to get used to |
Tableau
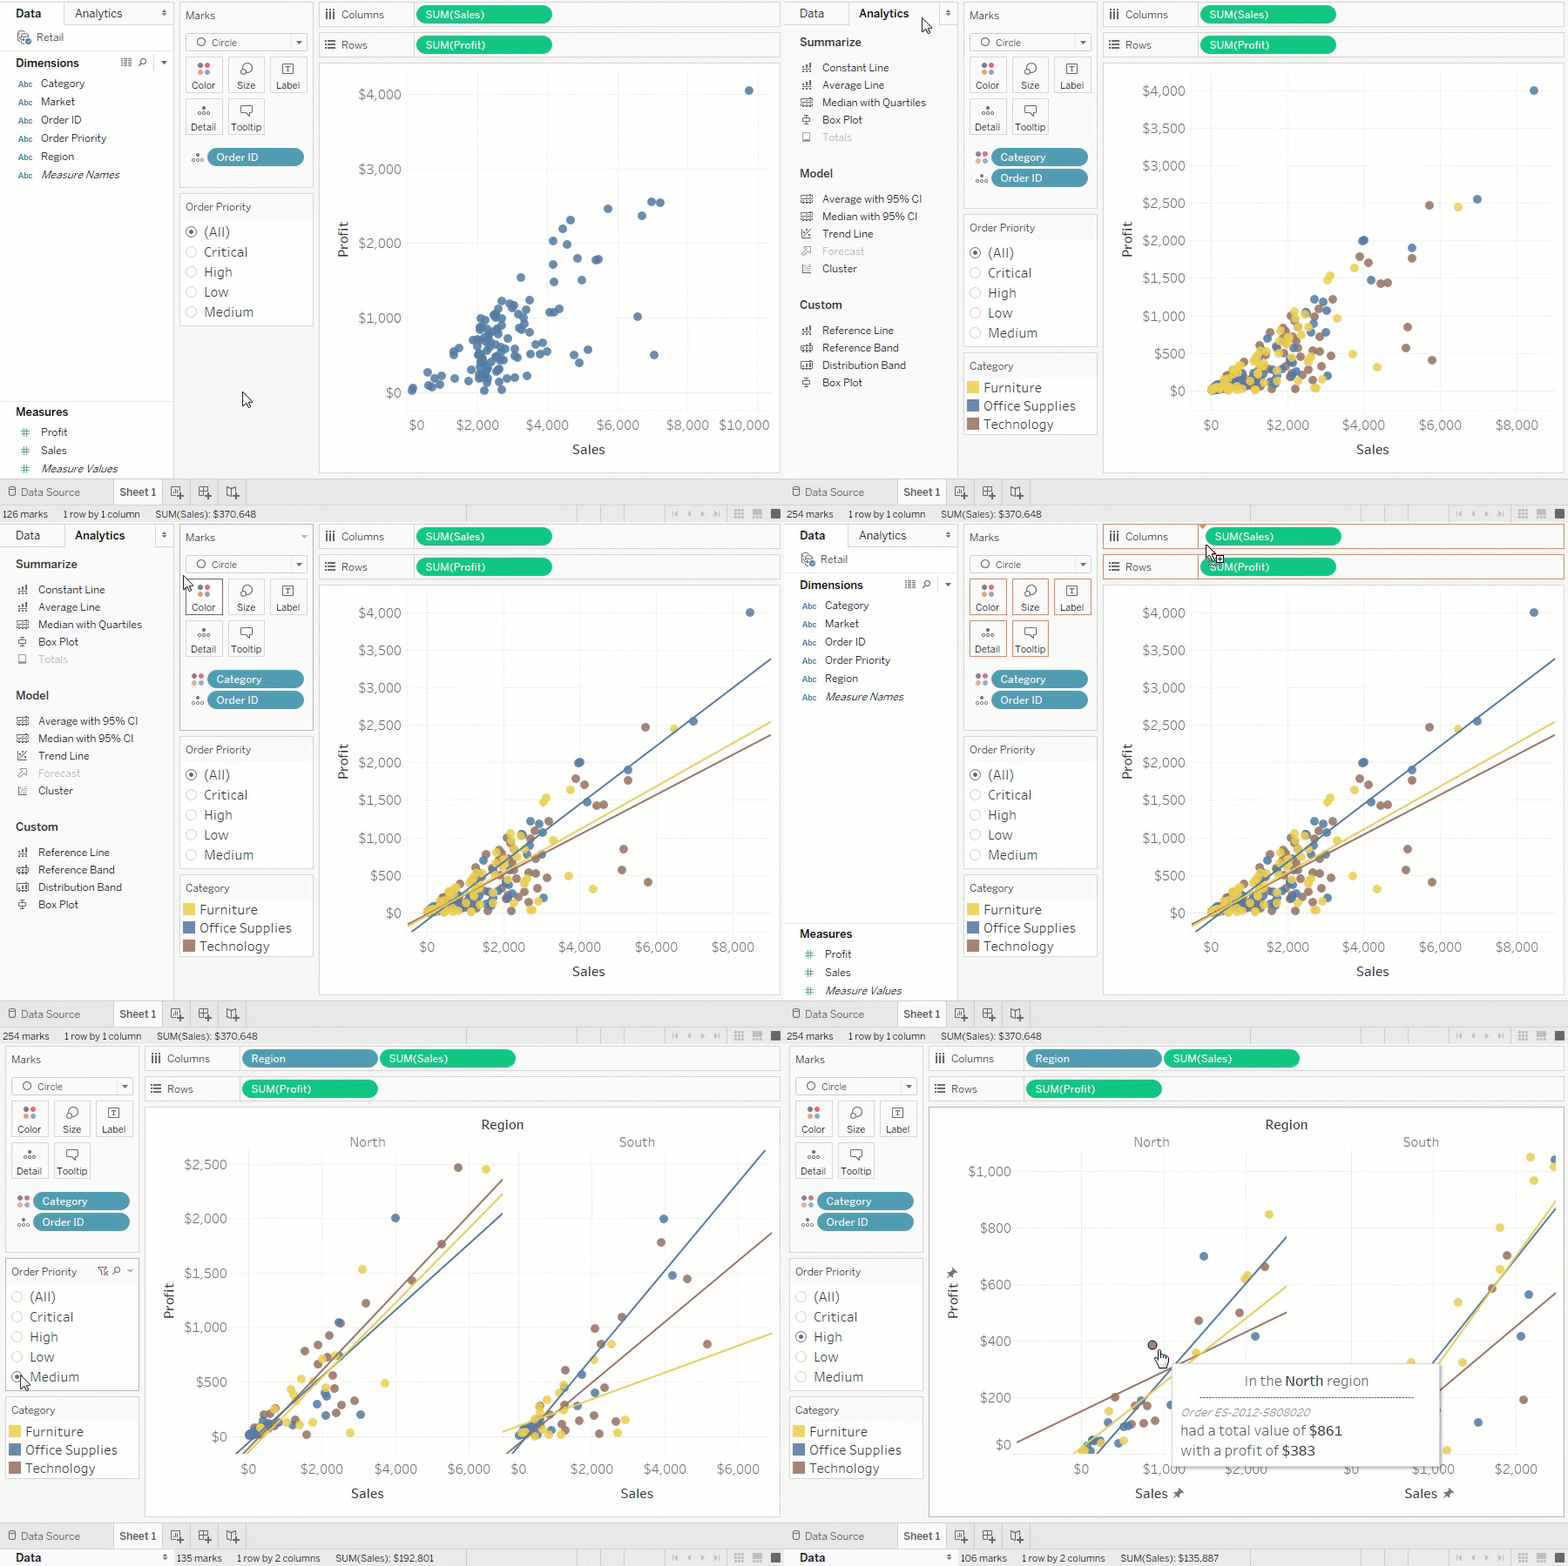
Tableau is a market-leading Business Intelligence tool used to analyze and view data in a simple manner. It has been named as a leader in the Gartner Magic Quadrant 2020 For the eighth consecutive year. Most companies have made it a requisite for incoming Data and Business Analysts to have first-hand knowledge about Tableau.
Tableau allows users to create reports and share them across desktop and mobile platforms and within a browser. You can even embed it in an application. This tool was developed on a high-performing language called VizQL. It enables seamless drag-and-drop dashboards and a myriad of visualization components. Its big data capabilities make it popular in the market. Enterprises that use Tableau extensively are Citibank, Skype, and Deloitte.

| Advantages | Disadvantages |
| Ease of use and high performance | High cost and poor support |
| Mobile-friendly and can be integrated into applications | Security issues, fewer updates |
| Multiple data source connectivity | Poor Business Intelligence capabilities |
| Wide set of visualization tools and reports |
SAS Business Intelligence and Analytics Tool
SAS is widely known for its ability to automate the mining of vast amounts of data. SAS offers services like event modeling, what-if analysis, and scenario planning. It has an easy-to-use interface. SAS contains a wide variety of modules to add to a data analyst’s arsenal. These include but are not limited to SAS analytics for IoT, SAS Anti-money Laundering, and SAS Analytics Pro for Midsize Business.
Another advantage SAS offers is that it can analyze data from any source. It finds its use in businesses that deal with real-time data, especially social media and marketing analytics. SAS continues to be the best out there in terms of robustness, versatility, and as an all-in-one tool.
| Advantages | Disadvantages |
| User-friendly GUI | Expensive and not cost-effective compared to R Studio, Python |
| Easy to collaborate | Getting started can be intimidating |
| In-built tools to clean, filter and transform data | Data Visualisation charts are comparatively bulky |
Widget not in any sidebars
QlikView
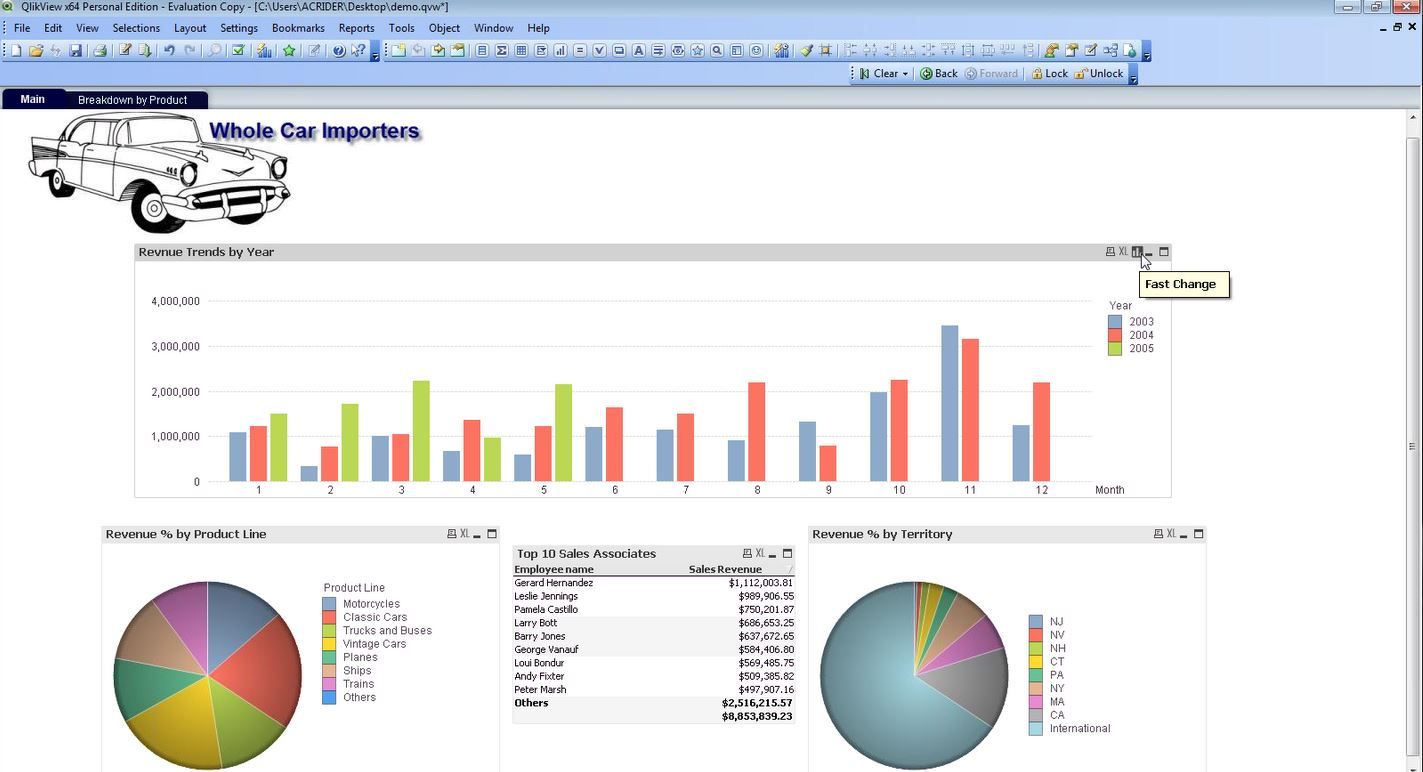
QlikView is steadily making its mark in the market of data analysis tools. It offers solutions for business intelligence and data visualization. It is quickly evolving and has been named a Leader in Gartner Magic Quadrant for Analytics and BI platforms in 2020. Companies like CISCO and Samsung use QlikView to accelerate their business value.
QlikView supports a wide range of charts that users can customize with embedded SQL as well as drag-and-drop modules. Business can be flexible in implementing QlikView via on-premises or on the cloud. It supports a powerful array of tools for data exploration. It is popular among technical as well as non-technical professionals.

| Advantages | Disadvantages |
| User-friendly GUI | Expensive and not cost-effective compared to R Studio, Python |
| Easy to collaborate | Getting started can be intimidating |
| In-built tools to clean, filter and transform data | Data Visualisation charts are comparatively bulky |
KNIME
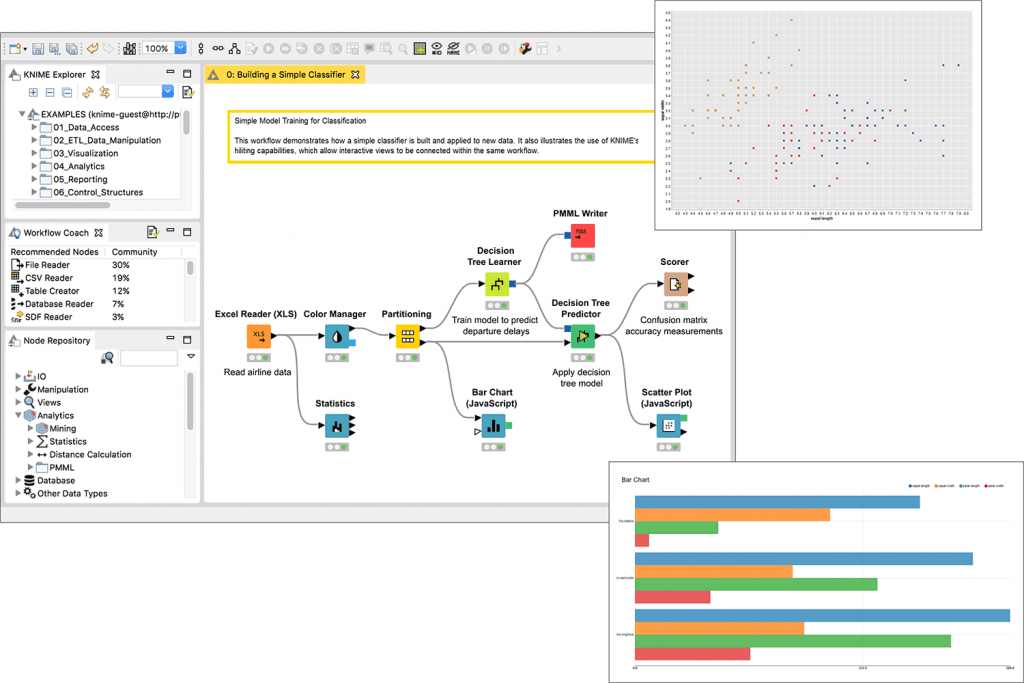
KNIME is at the forefront as an open-source tool for reporting and integrated analytics. KNIME stands for Konstanz Information Miner. It incorporates key concepts of data pipelining. Knime is a one-source solution for integration, processing, and visualization. It is popular among data analysts who don’t have strong programming prowess but need to implement machine learning and statistical models. The interface allows for point-and-click analysis and chart creation.

| Advantages | Disadvantages |
| Allows for large dataset processing | Low performance in managing data |
| Open-source and integrable with Python and R | Problems with import of multiple sources of data. |
| Free and easy to learn | Simple tasks can take longer, heavy CPU use |
Splunk
The Splunk software promises to help unlock the hidden value of this data. It provides an integrated way to organize and extract real-time insights from massive amounts of data from virtually any source. It aims to provide end-to-end solutions to analyse machine data and to create powerful dashboards.

| Advantages | Disadvantages |
| Flexible interface | Bulky installations |
| Ability to ingest data from multiple sources of different types | It has a specialised query builder that requires time to get acquainted with. |
| Great for data visualisation of log data | High cost |
RapidMiner
RapidMiner is a powerful integrated data science platform that performs advanced analytics like data mining, text analytics, machine learning, and visual analytics without any programming. Data analysts can perform a broad range of operations using a simple graphical interface. It is also capable of being extended using R and Python.
| Advantages | Disadvantages |
| High-performance capabilities and can merge multiple data sources | Lack of learning resources |
| Performs transformations and filtering with no coding involved | Visualisations are not comparatively creative |
| Great machine learning toolset | Fairly complex user interface |
Zoho Analytics
The next tool in the list is a self-service BI application. Zoho Analytics is famous for being handy in handling data, making stunning visual graphs and discovering insights. It enables blending data from multiple sources and the collaboration of reports with colleagues. It’s reporting tool allows the easy creation of charts and dashboards to track business growth. It also comes with an in-built virtual assistant, Zia!

| Advantages | Disadvantages |
| Easily sync data with business warehouse and CRM tools. | Lack of support |
| Reporting and collaborations enable quick sharing | Complex setup procedure |
| Powerful data mining engine | Little to no customization |
Sisense
Sisense BI Tool provides a platform to unleash the power of data, enhance customer experience and grow your business venture. It possesses a large collection of drag-and-drop tools and provides interactive dashboards that can be collaborated. Sisense allows secure data connections and to build dashboards with a robust library of widgets. One of the leaders in the data analysis tools market, companies like Philips, Skullcandy, Nasdaq and GitLab make use of the very powerful Sisense!

| Advantages | Disadvantages |
Ease of Use and great customisation options | Stability issues with huge volumes of data |
| Known for great customer service and regular updates | Need for better graphing tools |
| Combine data from multiple sources | Basic visualizations and reports |
Hope this FireBlaze AI School post helps you choose the right business intelligence tool to cater to your specific needs. Data visualization and analysis tools are becoming more and more indispensable in the current market scenario. If you want to become a quality data analyst, make sure to learn the basics of at least some of these tools.


Great article on the introduction of top data analytics tools which every data scientist should be aware of